Requirements
General
The Numbrz application is best viewed on the latest desktop version of the Google Chrome web browser. Other browsers may work but are untested and not supported during the beta period.
Data & Workflows
The simplest method for linking to external data during the beta is via Google Sheets. To Use Google Sheets, you need an account with Google. You may also use your Google account to log in to Numbrz.
Functions
Overview
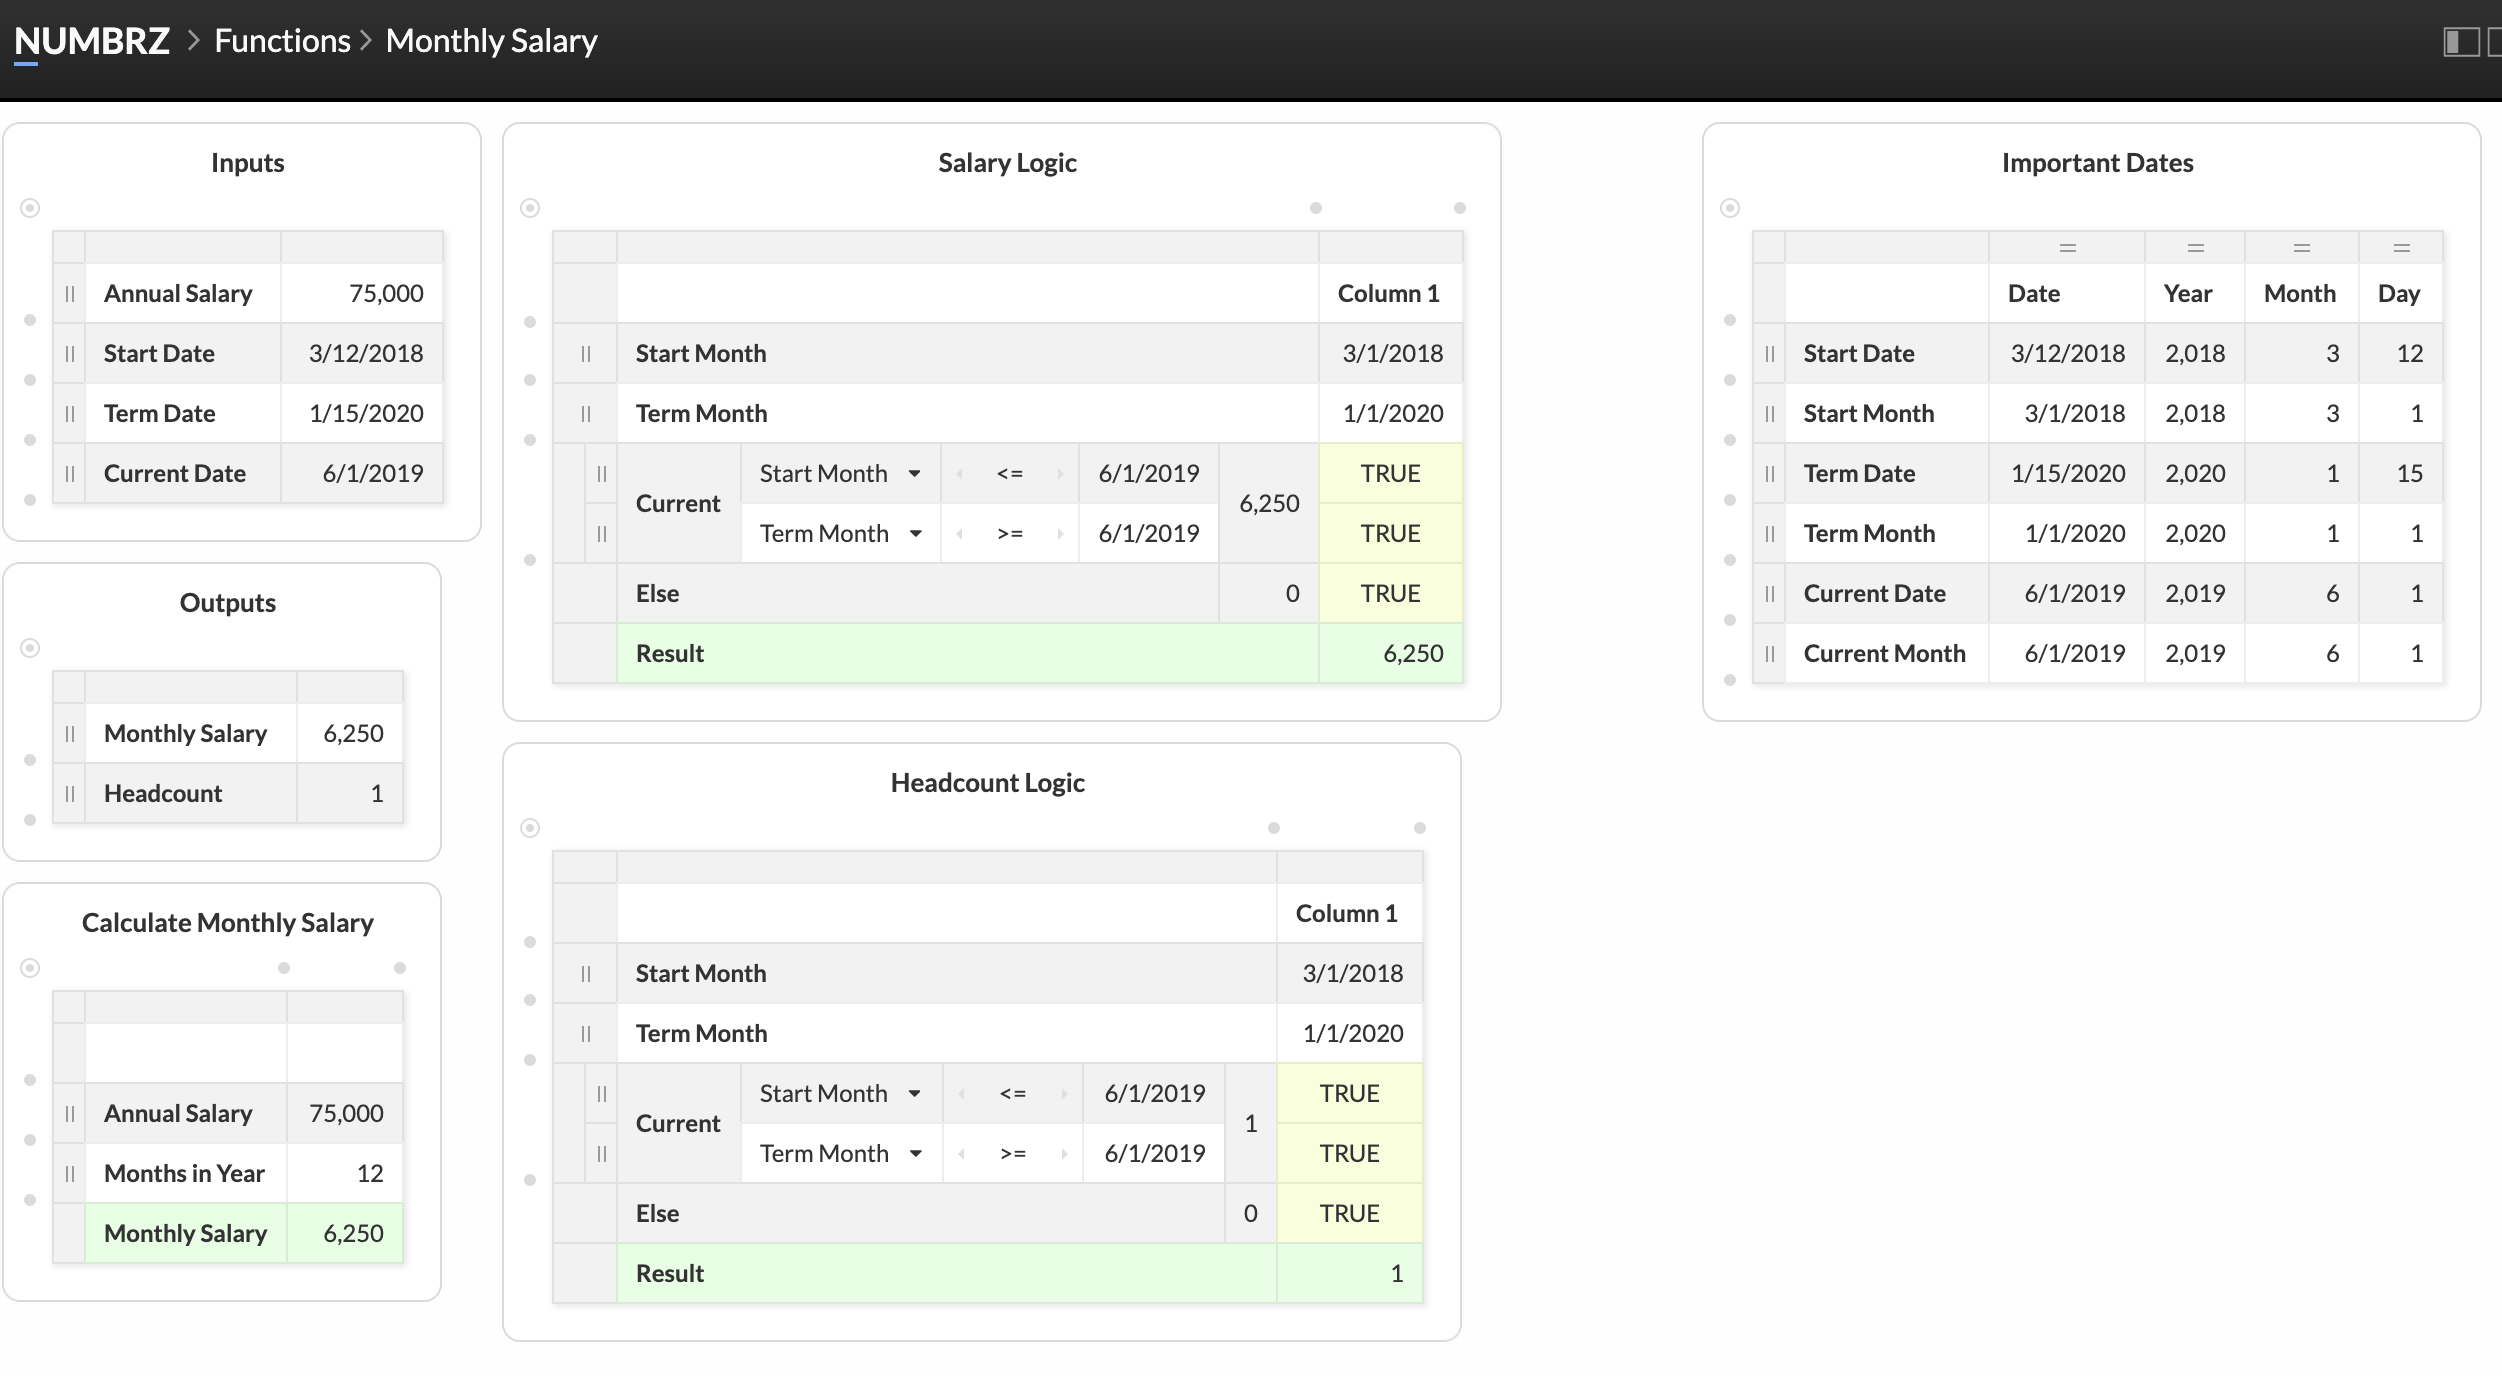
Calculations are built graphically in Numbrz using the Modeler. A function is a collection of widgets which provide a variety of capabilities like accepting input, producing output, simple arithmetic, and conditional logic.
Canvas
Numbrz modeler canvas allows users to quickly create and connect pieces of logic that will eventually drive the execution of the workflow. Every Numbrz function is represented by a single canvas which may contain any number of widgets.
Widgets
Overview
Numbrz provides users with a number of pre-built widgets that can be combined, just like lego pieces, to create complex calculations and relationships between data. All widgets support a set of basic interactions: creation, deletion, insertion and deletion of rows or columns, rearrangement of rows or columns, and editing of any cell. The following video shows these interactions in action:
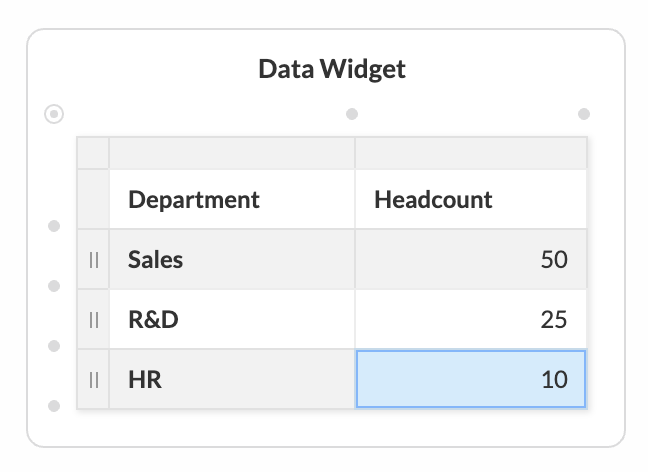
Data
This is the most basic widget inside Numbrz and it is most commonly used to store static variables used by the function. The data widget is also an integral part of the lookup widget.
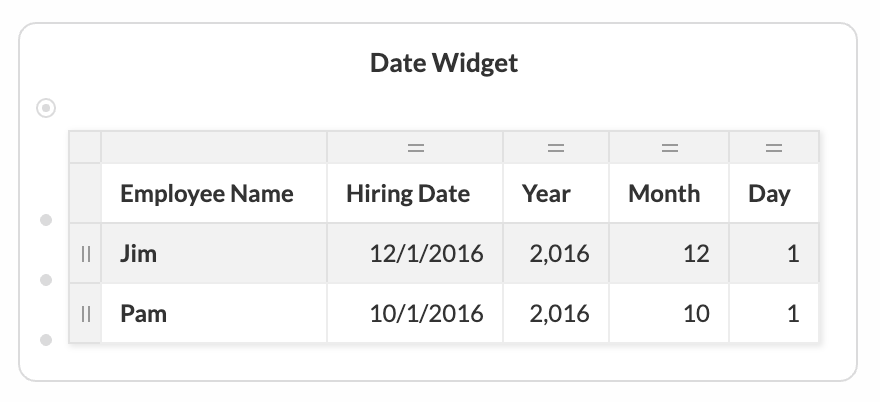
Date
Date widgets are used to parse and generate date values. Each row consists of a date value and its corresponding year, month and day. When a date cell is filled, the year, month and day are extracted. Conversely, a date value can be composed by filling in the year month and day cells.
Arithmetic
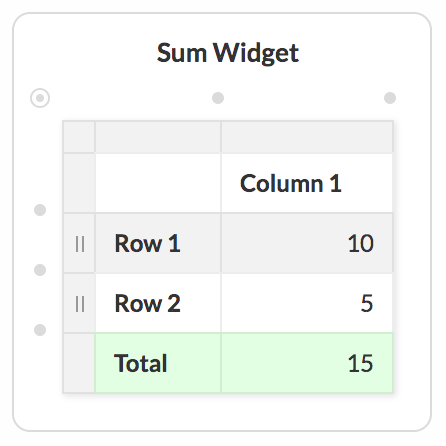
Arithmetic widgets can be used to perform basic math but in conjuction with Numbrz canvas they become powerful tools for representing complex calculations. Currently, Numbrz has 4 built-in arithmetic widgets: Sum, Product, Subtraction, and Division. The bottom row of the arithmetic widget contains the result value.
By default, the result is updated as the input values are updated. However, arithmetic widgets can be placed in control mode by explicitly specifying a value in the result row (either directly or via a link). In this mode, the result stays fixed, and a variance row is added which is updated as needed to to keep the result correct.
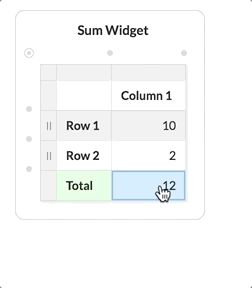
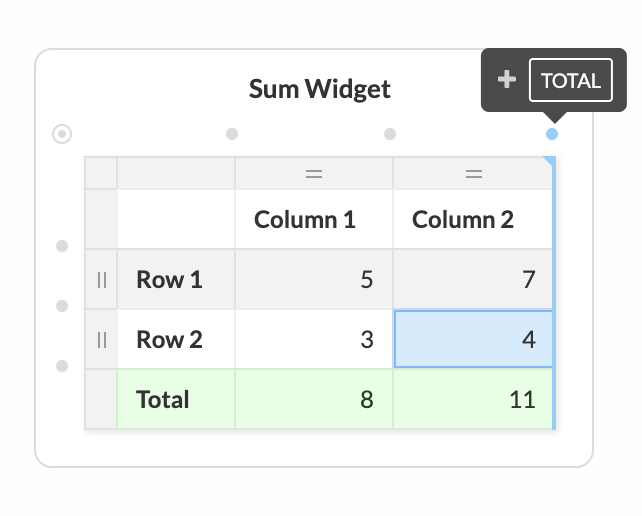
Depending on the widget, each cell of the calculated row is either the sum, product, difference, or the quotient of all the cells in that column. To see the calculated value across the row users can add a result column. To add a result column, locate the top right corner of the widget and click 'Total' as displayed in the image below:
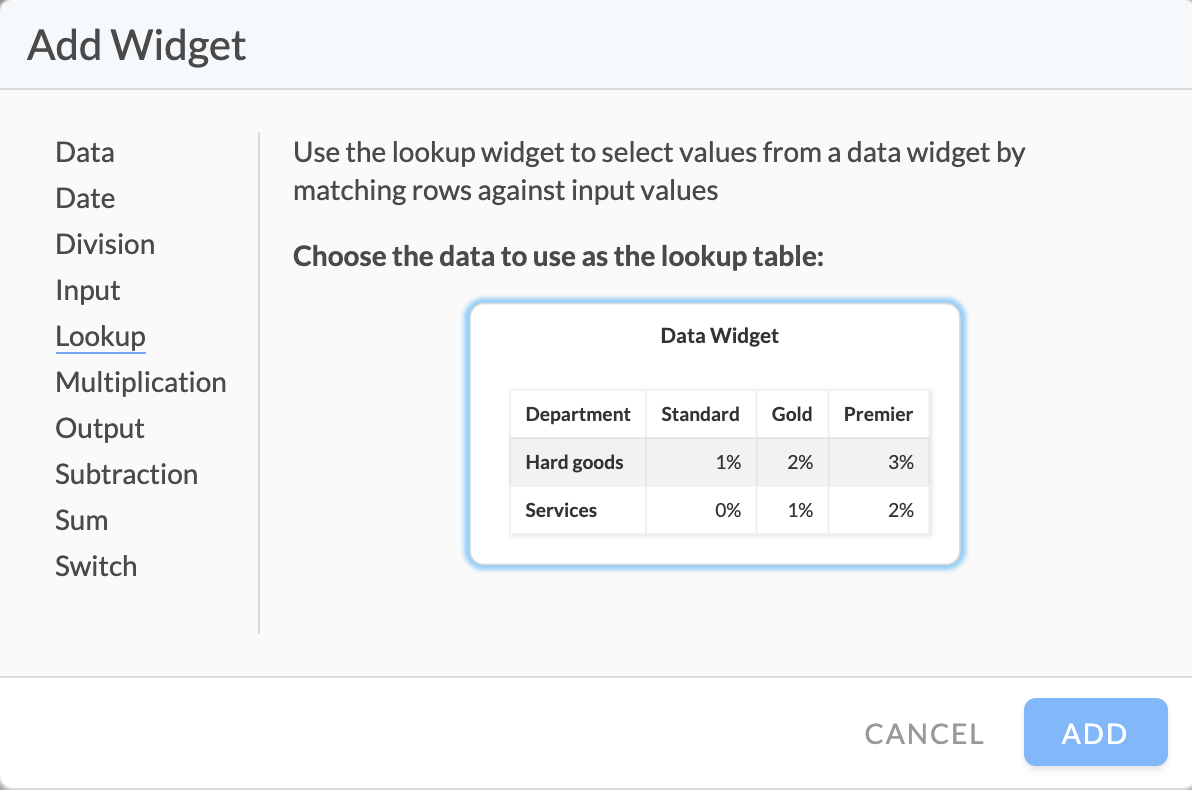
Lookup
A Lookup widget searches for a value (lookup value) in a specified column of a Data widget (lookup table) and returns the value based on search criteria.
Adding a Lookup widget is a two step process. First, create a Data widget to serve as a lookup table. Once a Data widget is present on canvas, you can create a Lookup widget by opening the Add Dialog (double click anywhere on canvas) and selecting 'Lookup'. Select the Data widget (click on the item in the list) to be used as the lookup table from the list.
We recommend all column headers of your Data widget are properly labeled prior to adding the Lookup widget. This will help you use the Lookup widget. You can also add and change headers after adding the Lookup widget.
The first column of the Lookup widget is a Label. It does not impact the Lookup function. Change this value as you wish.
The second column of the Lookup widget is the Lookup value. This can be a static value or a Link from another Cell.
The third column of the Lookup widget is a selectable popup value that represents the Data widget column from which to return the corresponding row value. You can easily change what result column is being returned. Values returned by the Lookup widget are presented in green cells. You can add more columns to the Lookup widget to return more results from different columns of the Data widget.
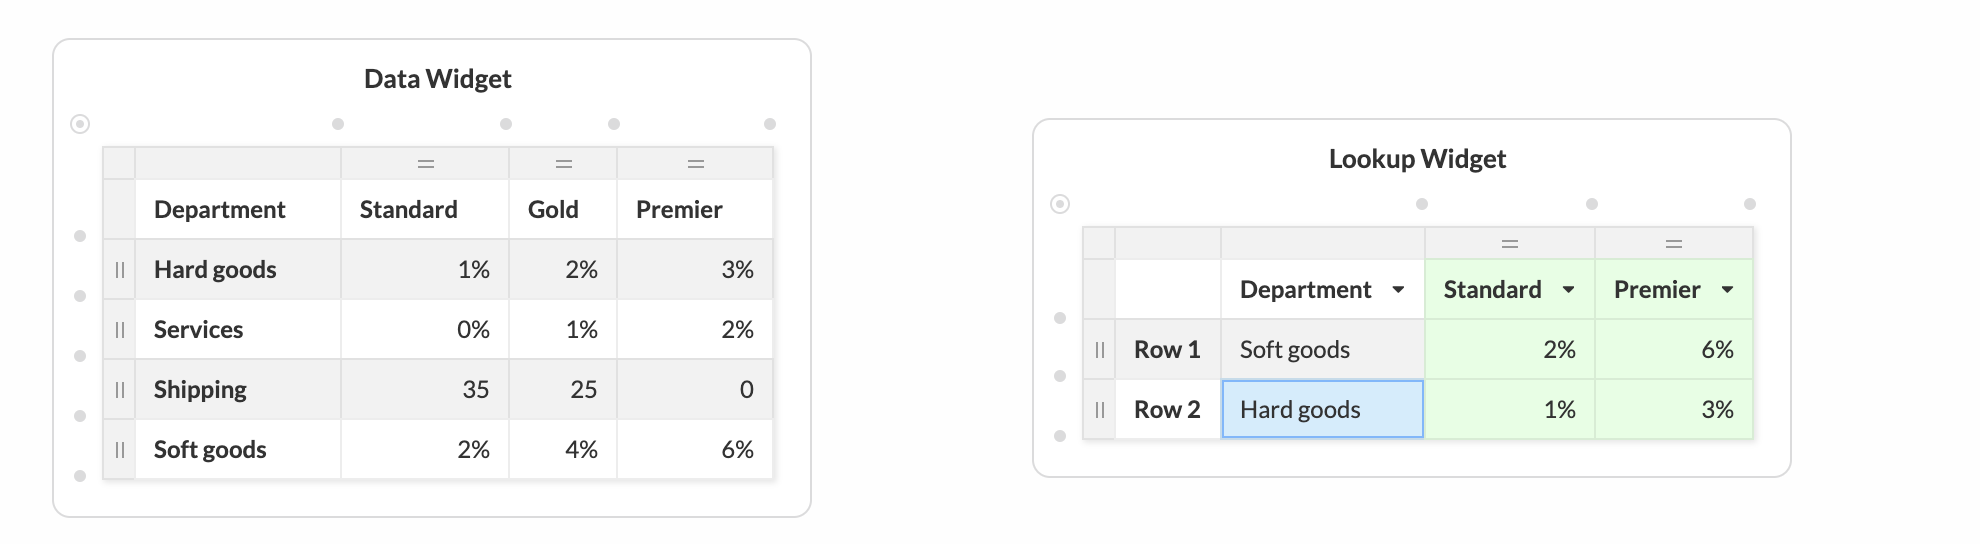
Note, the search column is not limited to the first column of a Data Widget. Use the column header popup to select the Data widget column that will act as the search column. For example, you could search on the third column and provide results from the fourth column.
In order to provide a correct lookup, it is recommended that your source Data widget is sorted in ascending order. You can easily reorder your rows by using the slider on the far left side of each row.
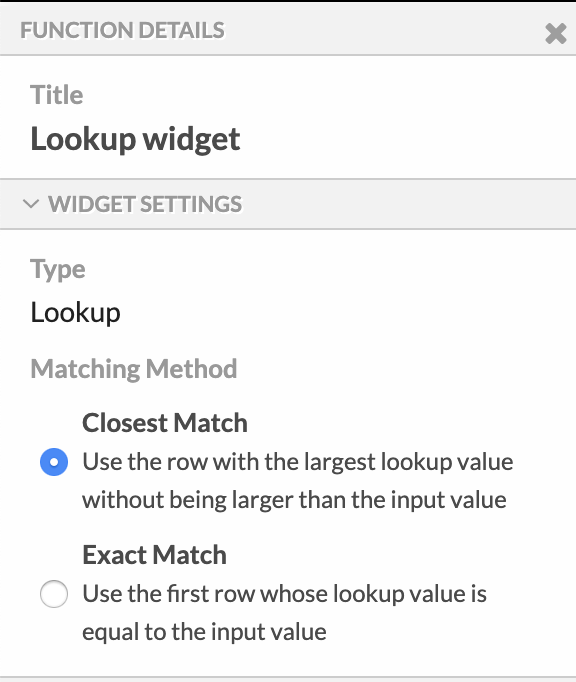
You can specify the closest match or an exact match for your row selection. Note, this setting applies to all lookups in that Lookup widget. If you want some values that are based upon the closest value and some based upon the exact value, you will need to add two Lookup widgets that reference the same Data widget.
The default search criteria is the closest match without going over the search value. In order to specify an exact match, select the Lookup widget to make it an active object on the Canvas and open the Left Pane. Select the ‘Exact Match’ radio button. This is in the top section of the Left Pane.
Below is a demonstration of how the Lookup widget is created and configured:
Switch
The Switch Widget allows you to add decision logic to your function. One or more values are evaluated against a set of rules, when a rule evaluates to true the widget result column takes on the specified value. When you incorporate links from other widgets to receive the values to evaluate and receive the results, some fairly complex functionality may be implemented.
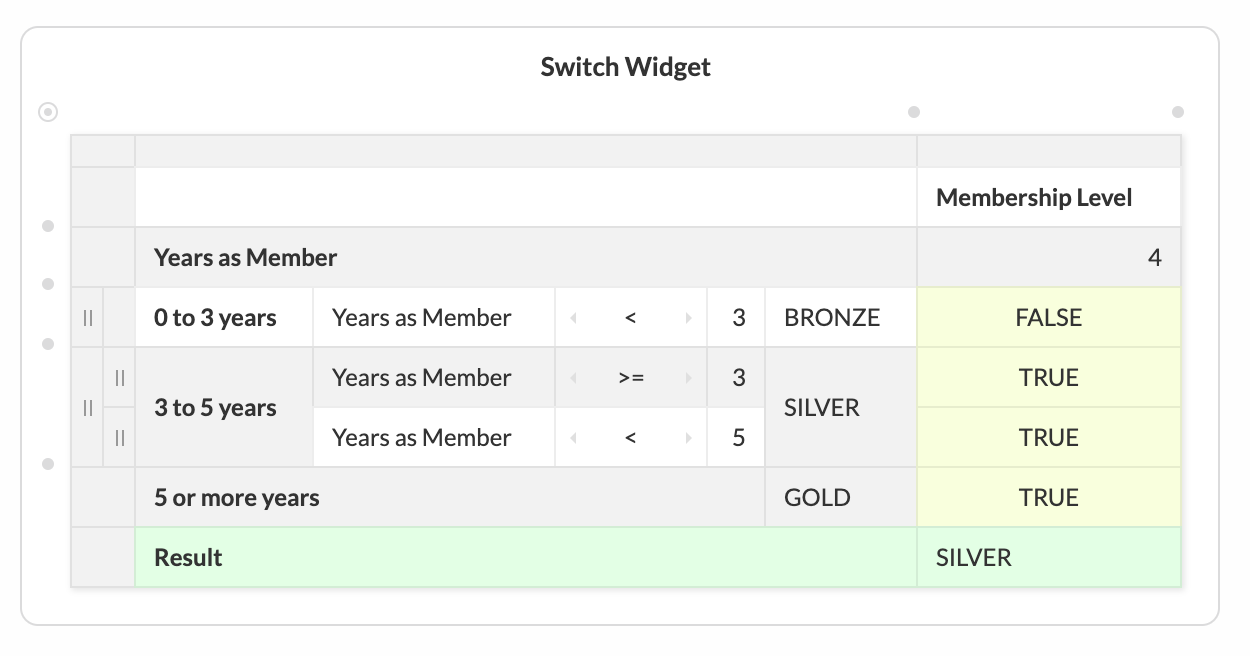
In the example above, note the three main sections:
- The variables section contain the inputs to the widget. You can add as may variables as you want. We have just one above, Years as member.
- The rules compare variables against other values, and specify the result should the rule match. Each rule contains one or more conditions and the rule matches only if all of the conditions of that rule match. Above we have 3 rules for calculating Bronze, Silver, and Gold membership levels.
- The result contains the result after applying the rules. In the above example, we have calculated the membership level to be Silver.
Below is a short video showing the addition of a new rule to an existing switch widget.
Input
Input widgets are used to specify the inputs that are accepted by a function. When running a workflow, the values in the function's input widget are filled in by the workflow engine. Functions can accept any number of inputs: each row in an input widget can be filled by a workflow.
Functions which do not contain an input widget cannot be used in workflows.
Output
Output widgets are used to specify the outputs that are produced by a function.
Functions which do not contain an output widget cannot be used in workflows.
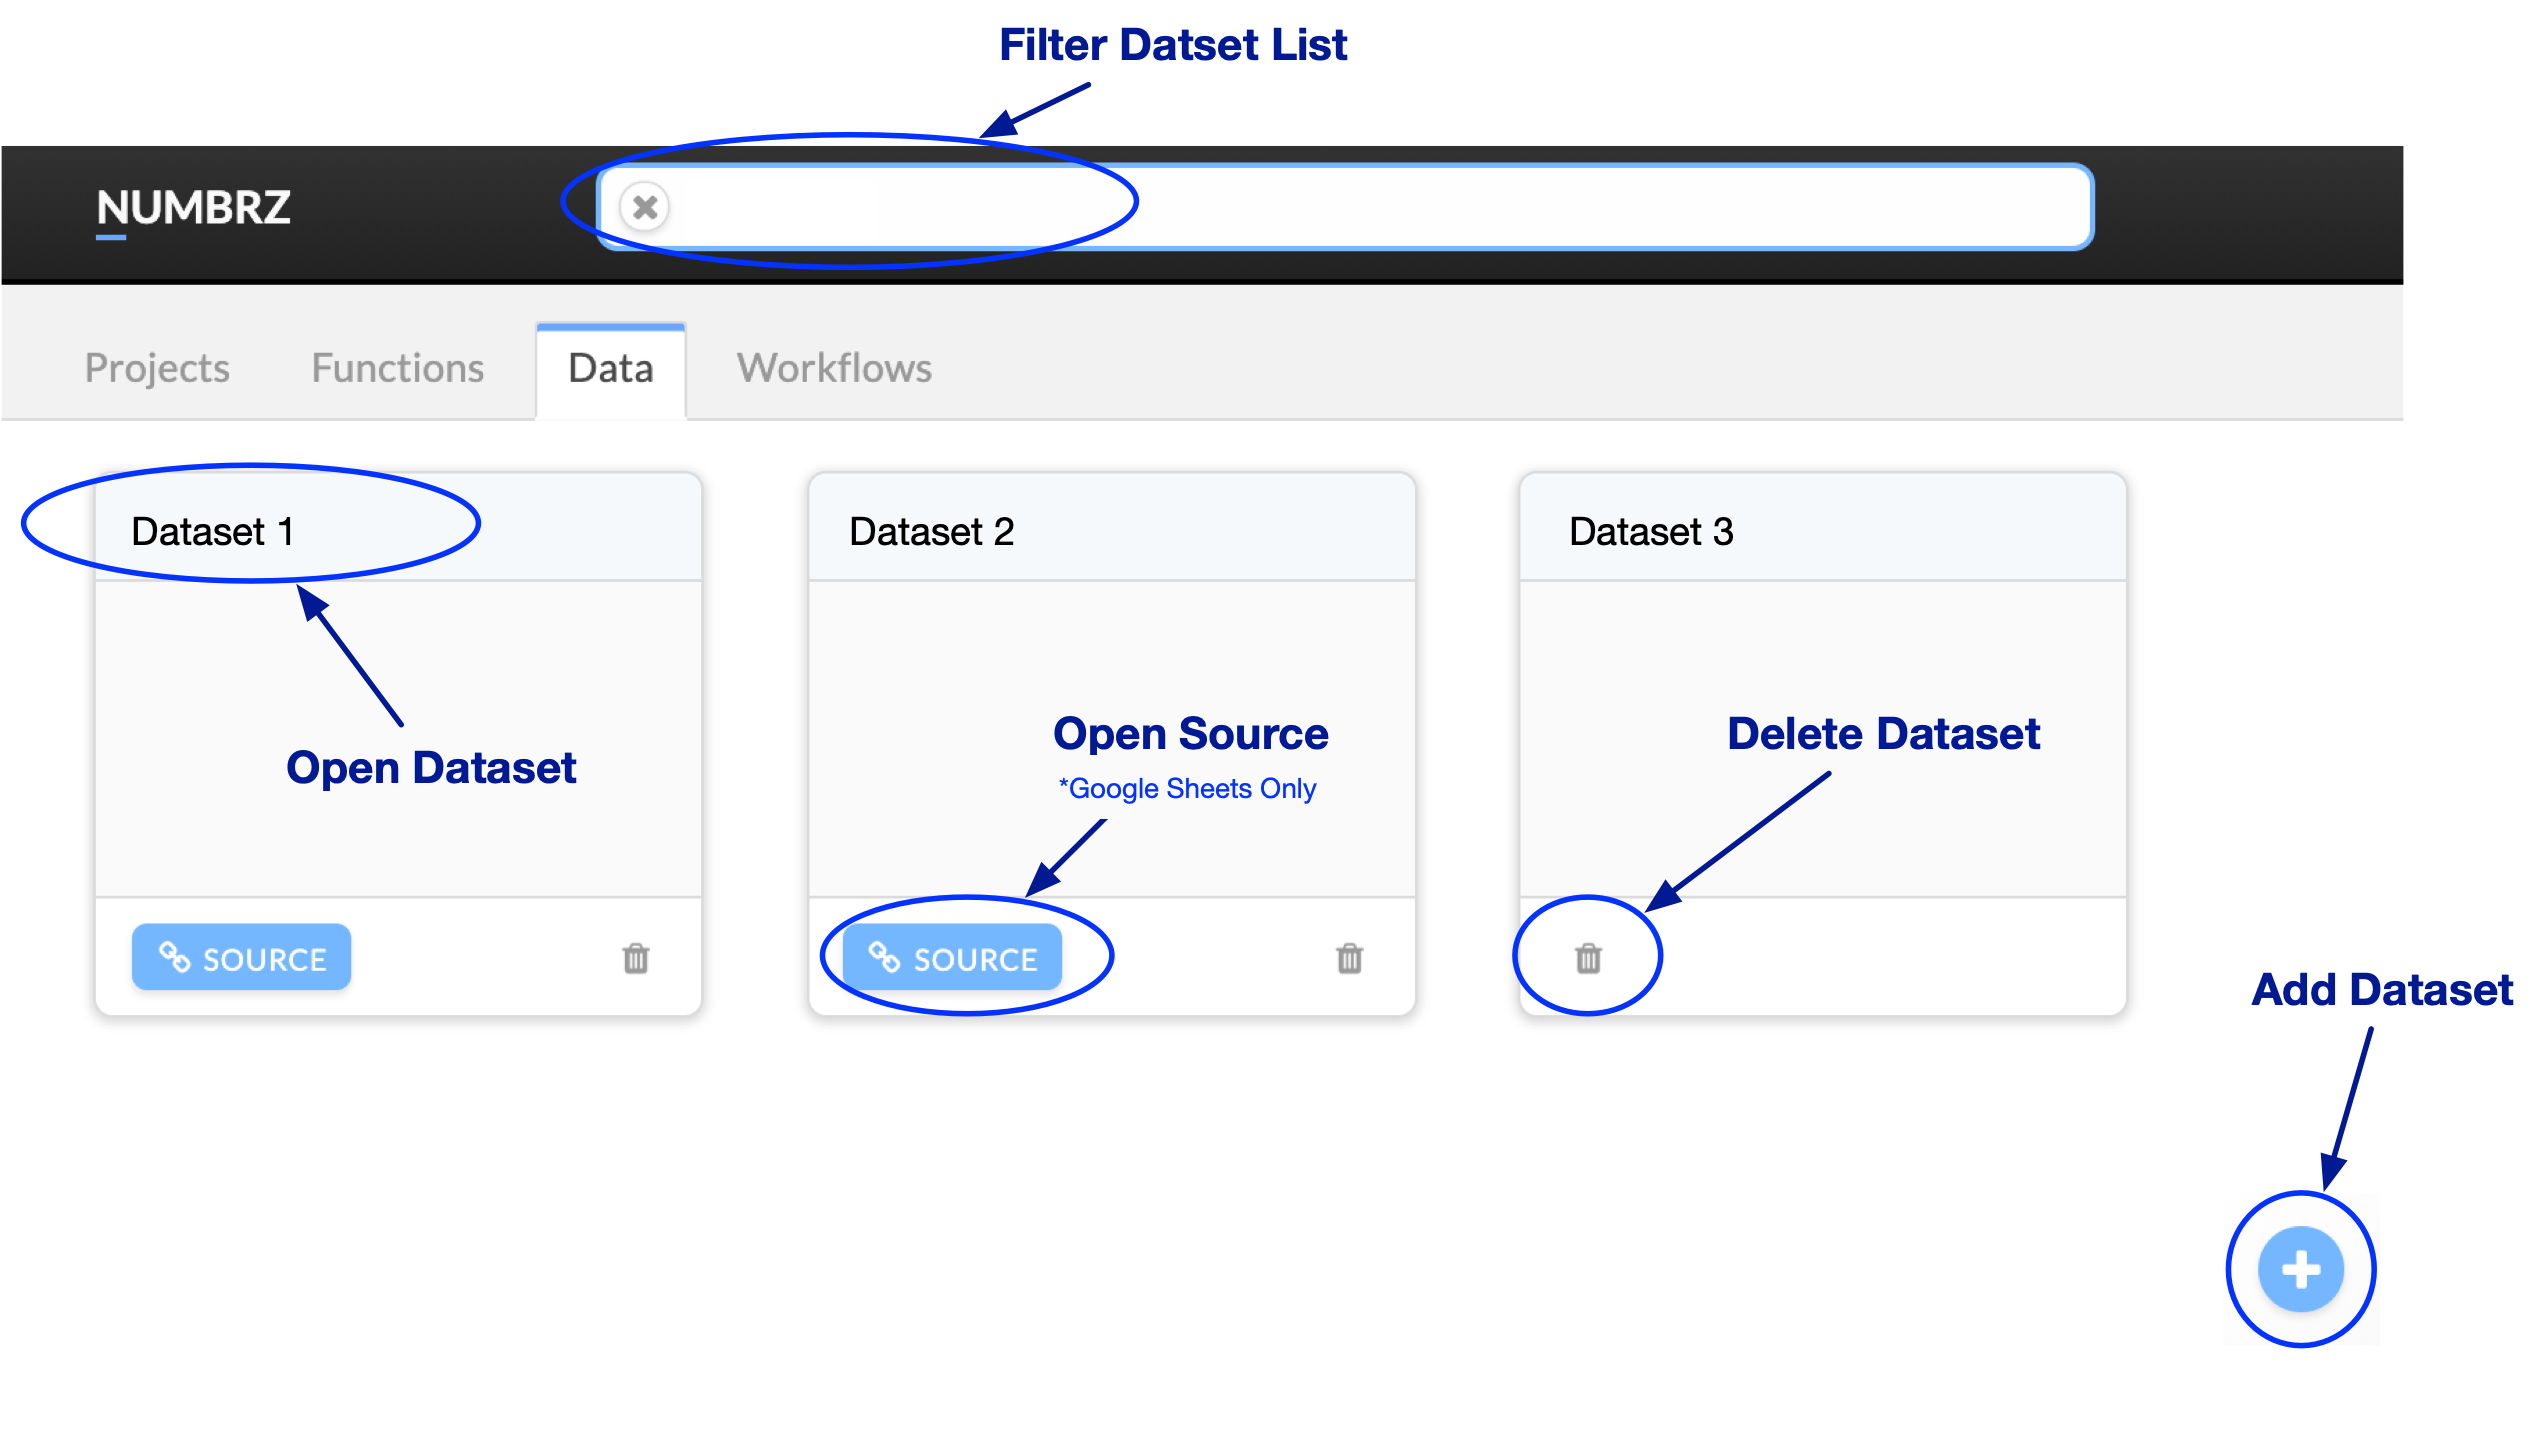
Data
Overview
Datasets are the unit of tabular data used by other components of the Numbrz ecosystem. Numbrz can read and write data from several sources. As the system continues to be developed, more sources will be added. Numbrz processes data by reading rows from a Dataset or by writing rows to a Dataset. Data is not imported into Numbrz, but rather is read or written via links to the data where it already resides. The datasets that are available to you are listed in the Datasets tab of the Numbrz application.
Working with Data in Numbrz
Your Datasets are organized under the Data tab of the Numbrz application or in a Project that you have established. You can delete a dataset you no longer want by clicking the Delete icon on the workflow list item. To change an existing dataset, click its title.
Creating Datasets
Google Sheets
Google Sheets is a popular online spreadsheet application. Numbrz natively supports reading from and writing to Sheets with a couple of important caveats:
- Your sheet data must be in tabular form with a single row of header labels.
- The table must start at cell A1 and have less than 52 columns.
- The table must have at least one row (i.e. the row starting at A2) of representative data (this is how Numbrz determines the data type of the cells).
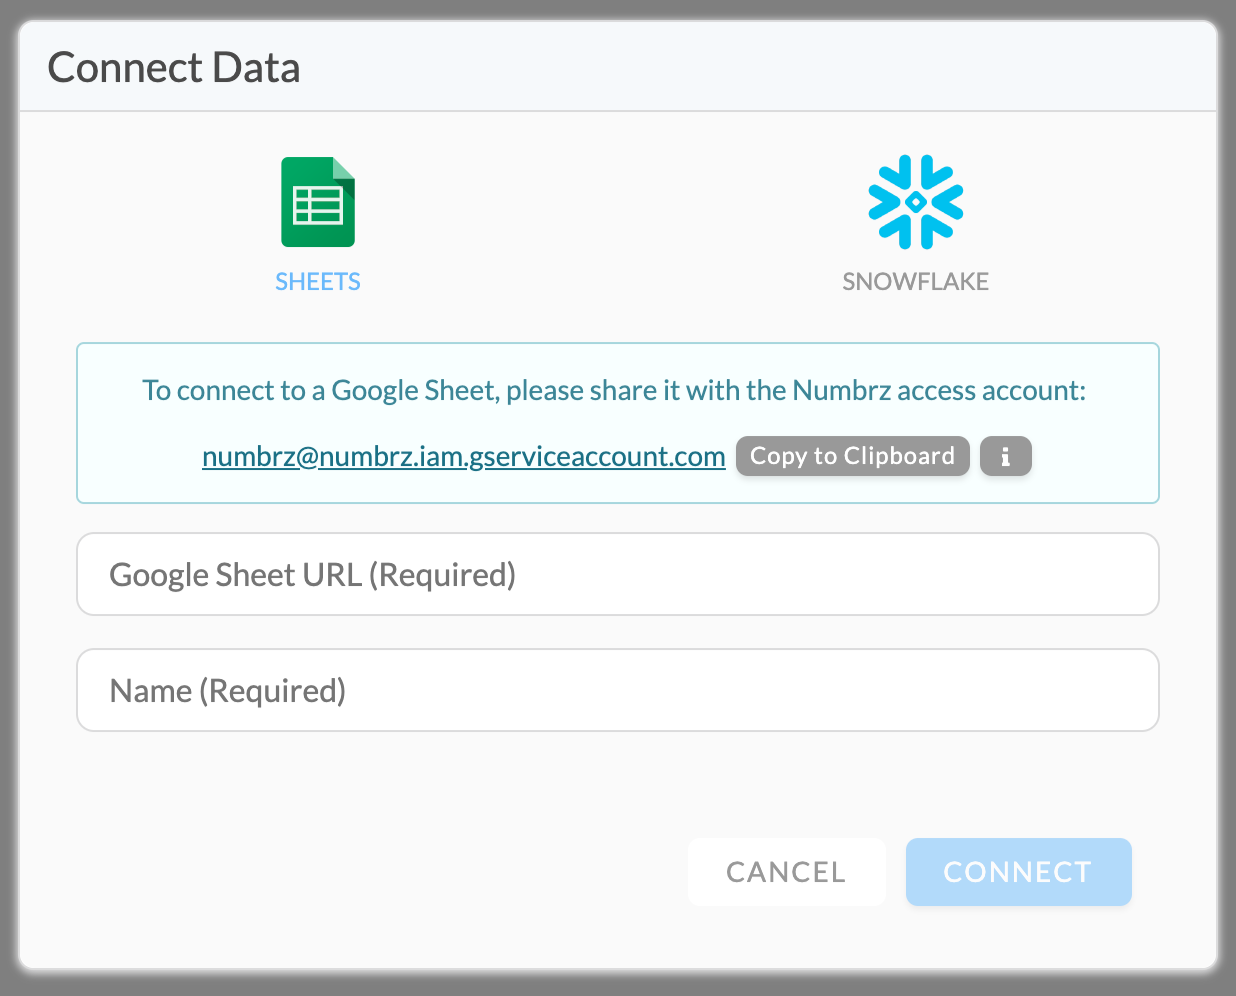
To add a Google Sheets dataset, click the '+' in the lower right corner of the Data tab. You will see the Connect Data dialog, Google Sheets is the default selection.
Before you can complete the link, you must grant access to the sheet to the Numbrz agent account. This is not done in the Numbrz application, but rather by using the Share button on the spreadsheet itself. Simply paste the email address shown in the Numbrz Connect dialog into the People field of the Google Sheets Sharing dialog (shown below).
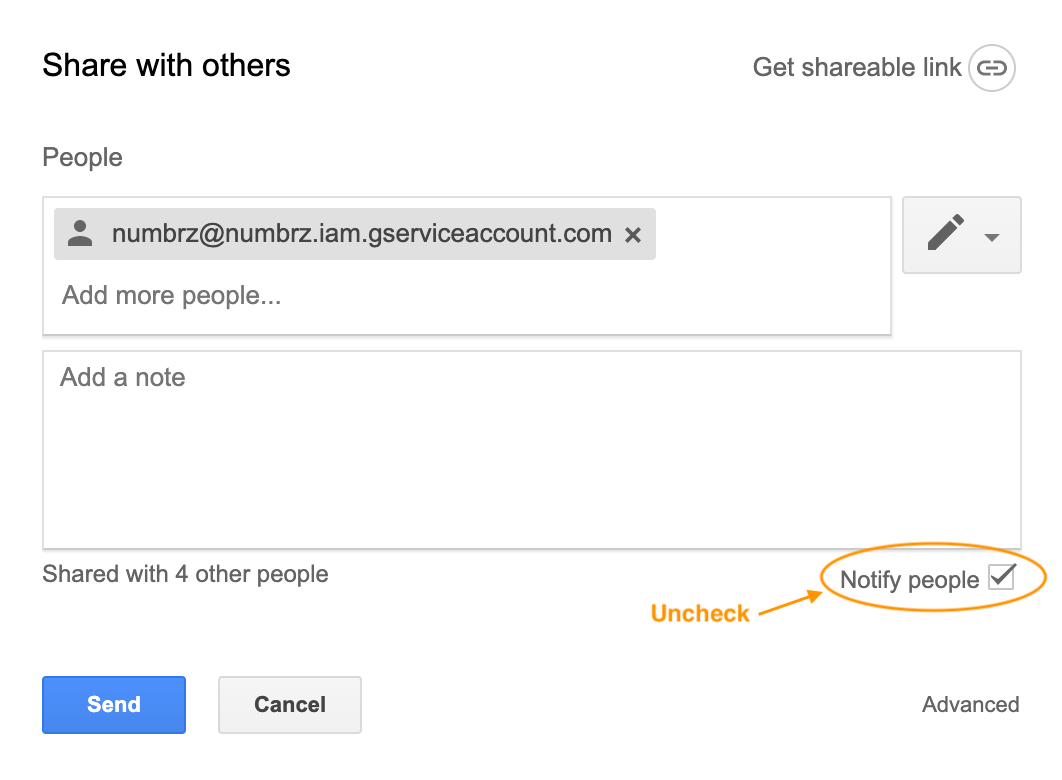
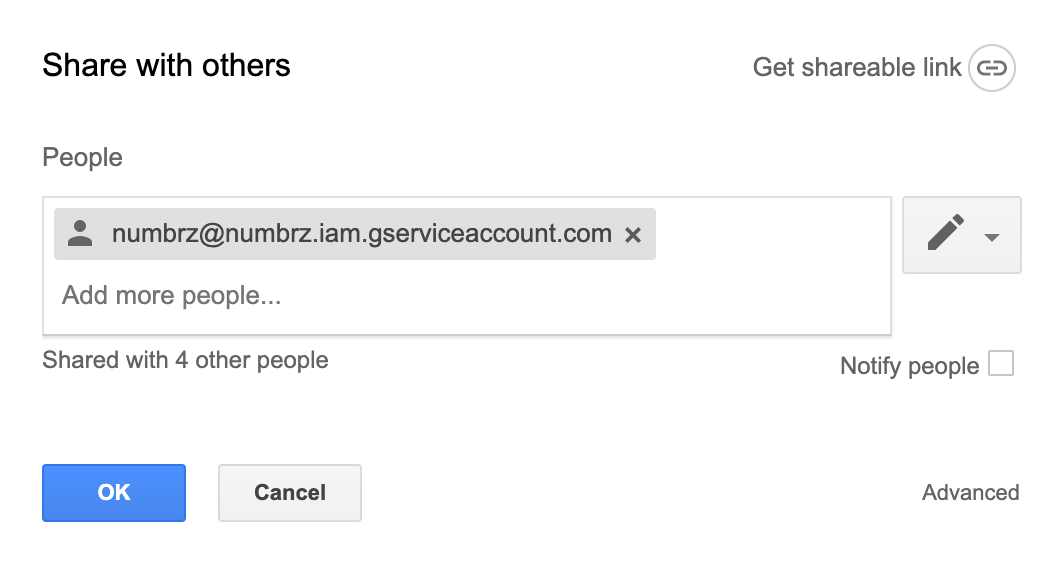
Be sure to uncheck the notify people check box, as shown above. Then click Send. The Google Sheets sharing dialog will appear like the second screen above, click OK. If you are prompted to 'Skip sending invitations' click OK and then click Done.
While in Sheets, copy the full URL of the sheet from your browsers URL bar, then go to Numbrz and paste it into the Numbrz Connect dialog. Give your dataset a meaningful name and click Connect.
Snowflake
Snowflake is a cloud-based data warehouse gaining popularity in many organizations. Numbrz natively supports reading from and writing to Snowflake database tables.
To add a Snowflake dataset, click the '+' in the lower right corner of the Data tab. You will see the Connect Data dialog, now click the Snowflake icon.
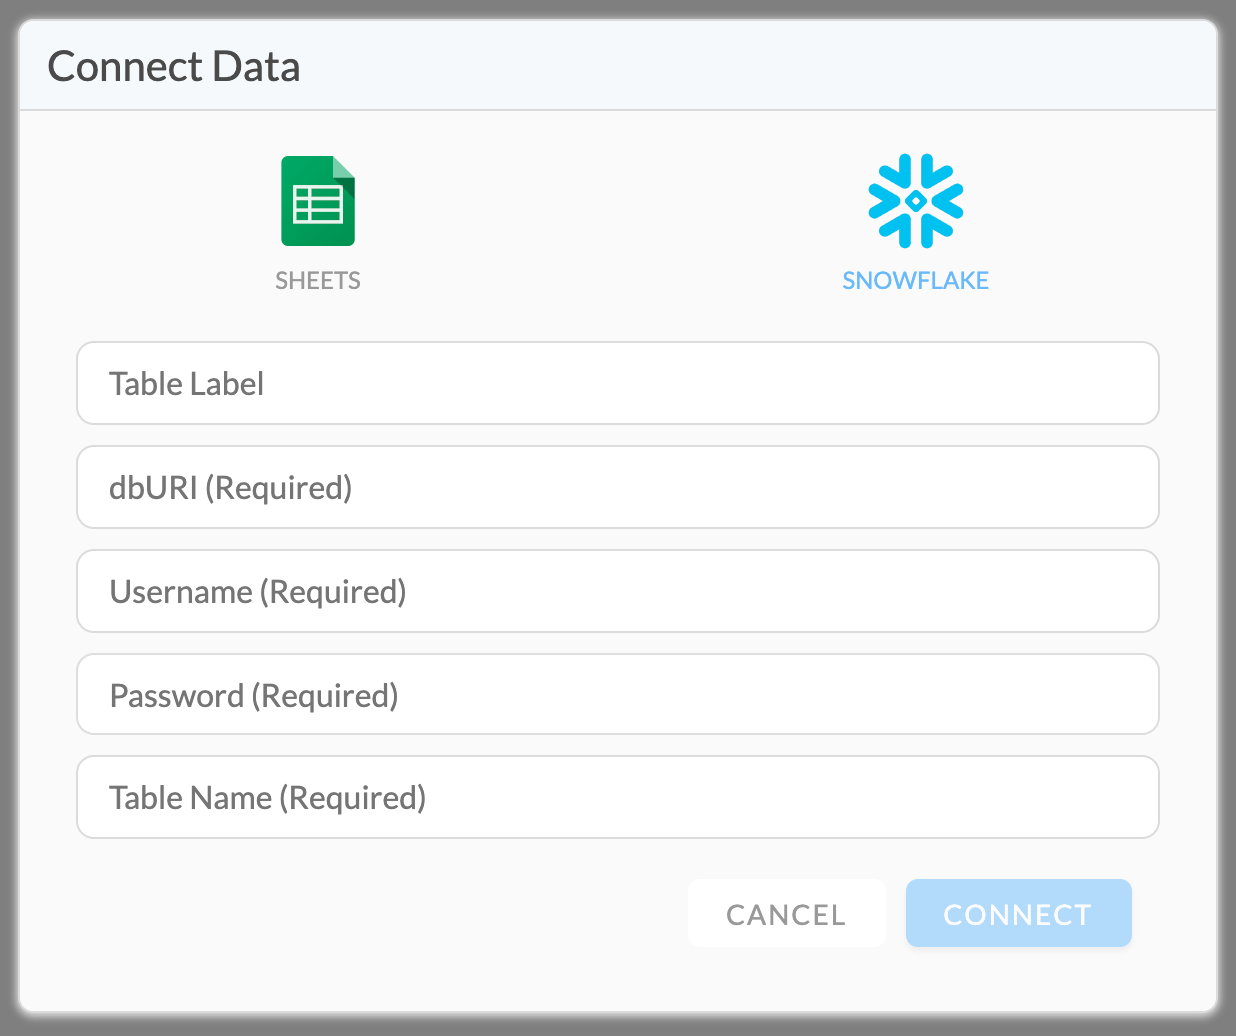
Before you can complete the link, you will need the Database URI. You may need to contact your Snowflake administrator to obtain this information.The URI has the form:
[ProjectID]/[DatabaseName]/[SchemaName]?warehouse=[WarehouseName]®ion=[AWSRegionCode]
- e.g. -
RCXXXXX/snowflake_sample_data/tpch_sf1?warehouse=test®ion=us-east-1
In addition, you will need a username and password with access to the table you wish to link. You may need to contact your Snowflake administrator to obtain this information. Once you have the required information, complete the dialog and click Connect.
Changing Datasets
The datasets that are available to you are listed in the Datasets tab of the Numbrz application. To change a dataset, click on the dataset you wish to work with to display its metadata. Numbrz linked data works by storing a small amount of information about the location and structure of your data. Note that it does NOT store any of the actual data.
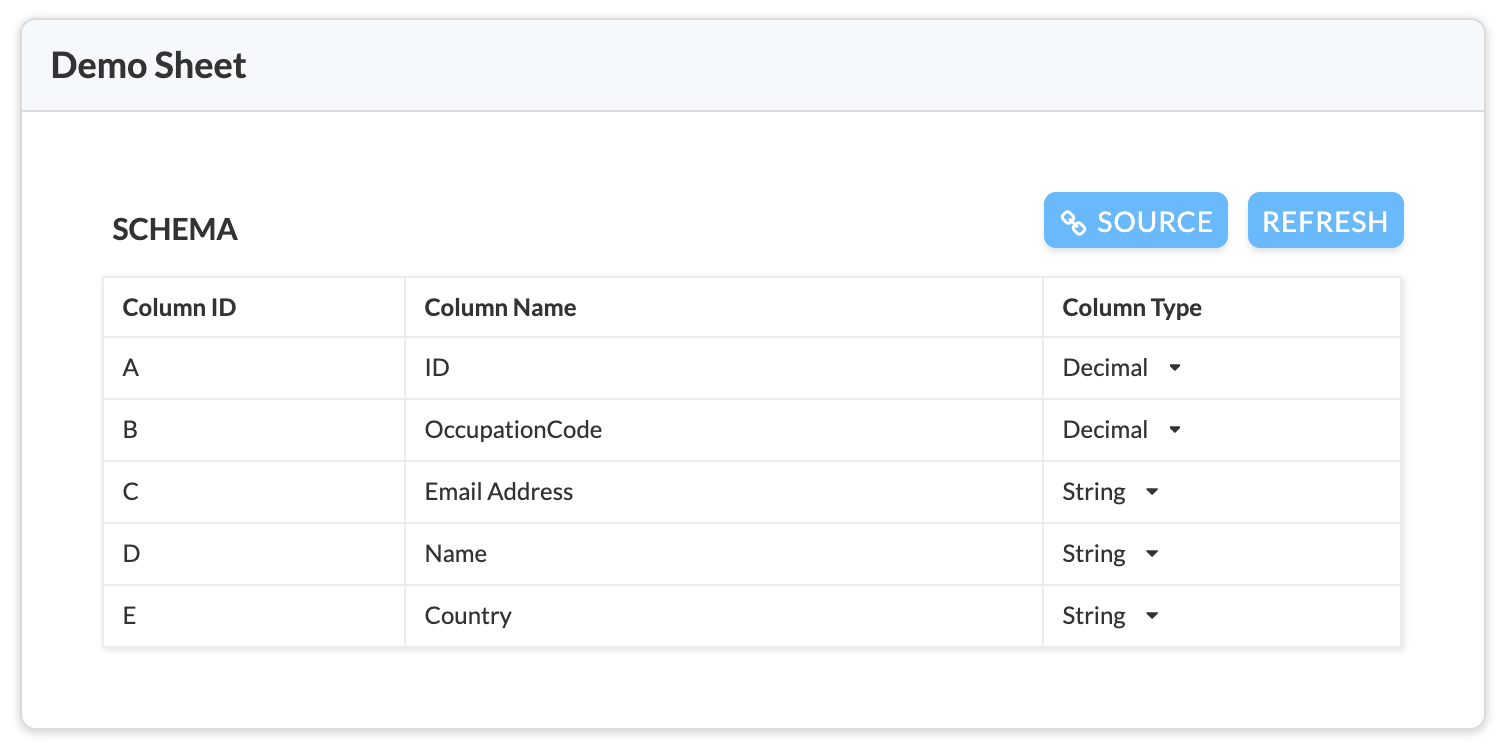
From time to time, this stored information may become out of date, for example, if you add new columns or change the data type of a field or cell. You can easily solve most such issues simply by clicking the Refresh button. In some cases you may need to select new data types from the drop-down menu under Column Type. This screen also allows you to update column labels if you so desire.
Workflows
Limits
During the Beta period the following limits apply to all users:
- Input Data Records are limited to 5000 rows
- Combine (see Combine Step) records are limited to 50 rows
- The total duration of a workflow is limited to 30 minutes
Please contact us if you have use-cases that exceed these limits.
Overview
Numbrz Workflows turn Functions and Data into powerful applications that run at the click of a button. Workflows read rows of data from an input Dataset and pass these rows through a sequence of user-definable steps that perform operations on the data. These operations include using the data as input to a Function, as well as a number of other steps such as filtering and aggregation. Finally, the resulting data can be written to one or more output datasets.
How do workflows work?
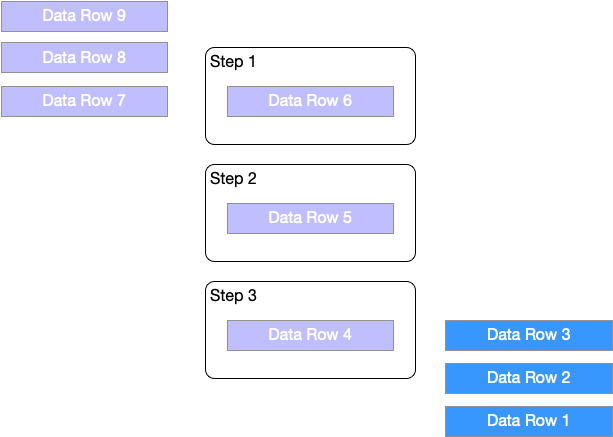
When executed, a workflow starts by iterating over all the rows in the input dataset.
It augments these rows with certain information about the workflow itself, and then
passes these augmented rows of data through its sequence of steps, one-at-a-time,
until all rows have been seen by all steps. Conceptually, this looks a bit like this:
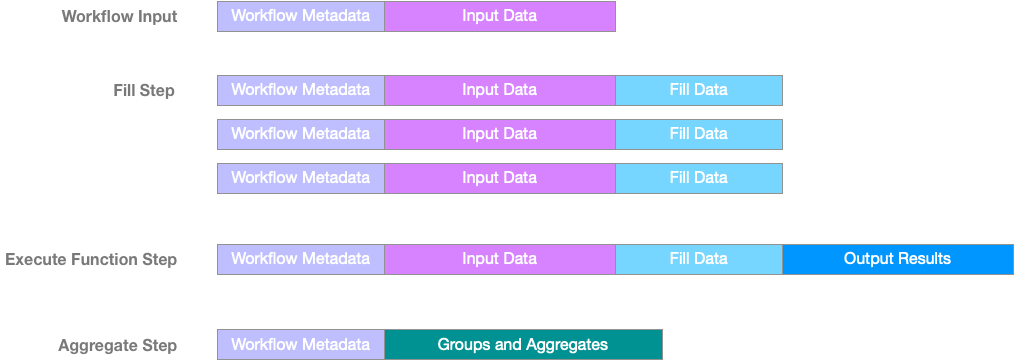
In a real-world, non-trivial workflow, processing is somewhat less straightforward. Steps may change both the structure and number of rows as they pass through. Steps that return results, the Execute Function step (discussed below) for example, have their results added to the row. In this way, downstream steps may further operate on the results of prior steps. In addition to augmenting the data elements in a single row, some steps may collapse data, emitting fewer rows from the step than it initially received; while others may expand it, emitting more rows than the step initially received.
The graphic below shows how data values in individual input rows may change depending upon the actions of the steps that process them. See the sections that follow for details on workflow steps.
Working with Numbrz workflows
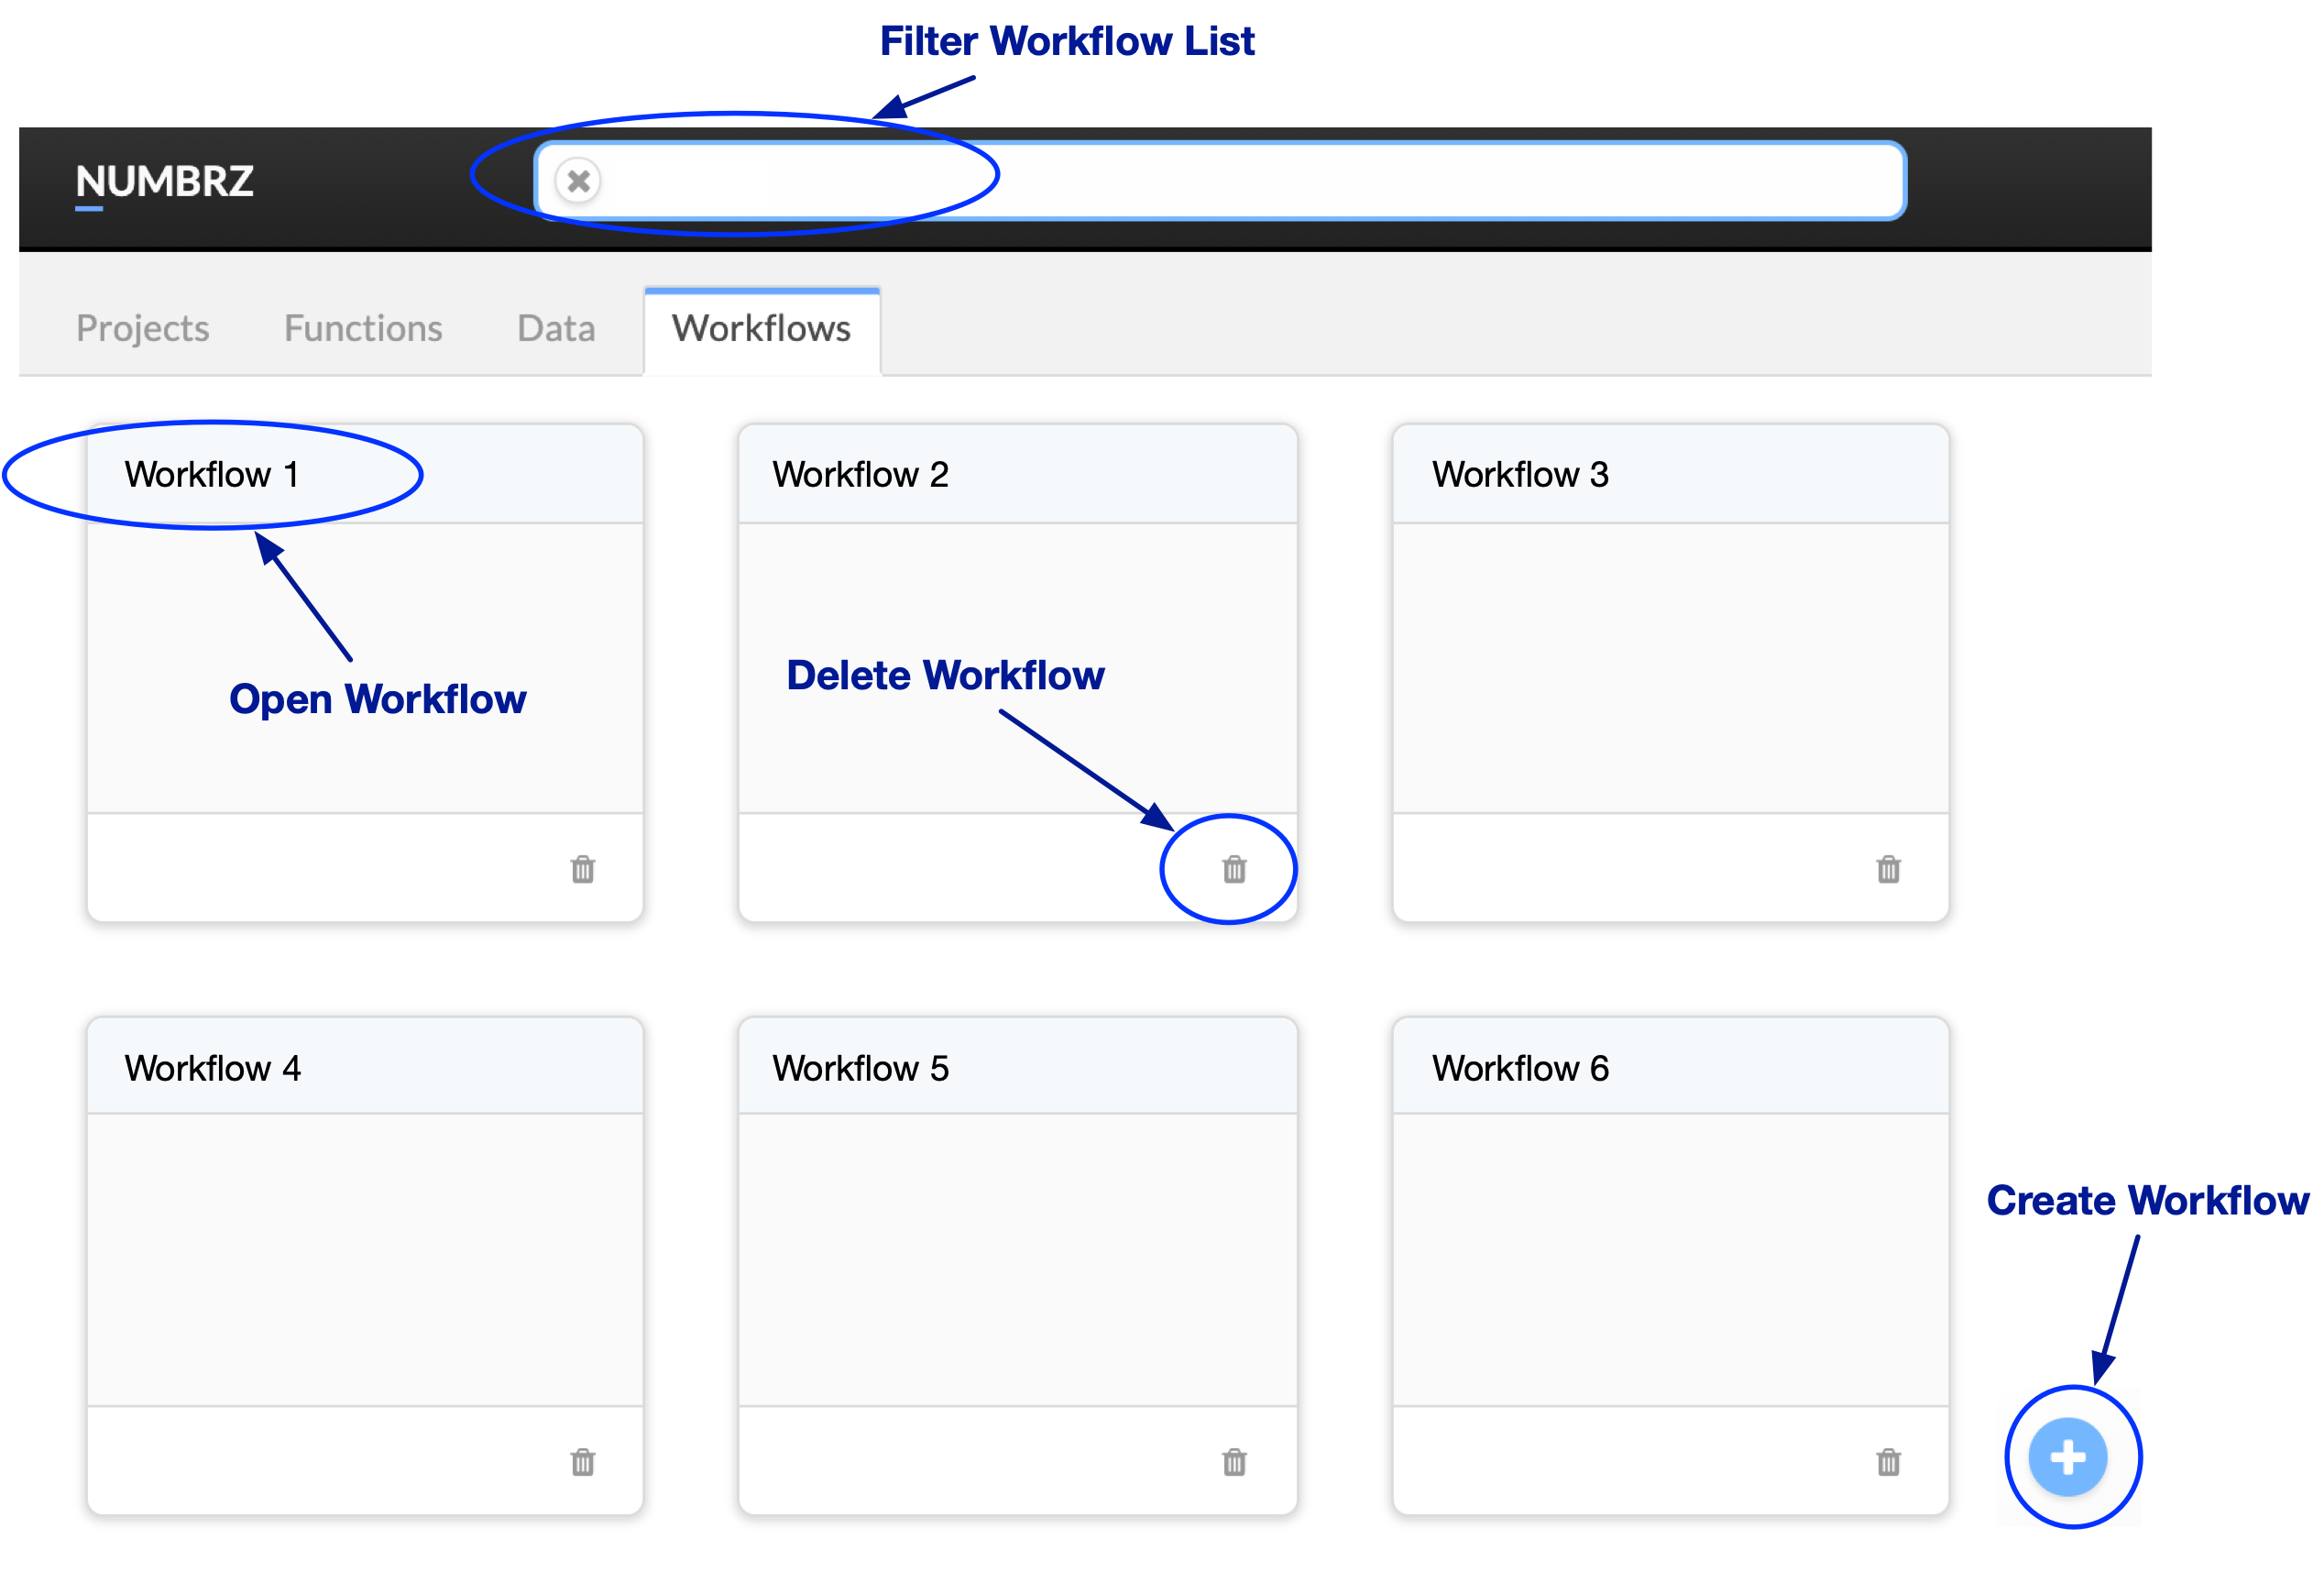
Your workflows are organized under the Workflows tab of the Numbrz application
or in a Project that you have established. You can delete a
workflow you no longer want by clicking the Delete icon on the workflow list item.
To edit an existing workflow, click its title.
Creating Workflows
Before you create a workflow, you should feel comfortable with the concepts described in the Functions and Datasets sections above. You should also have linked the appropriate datasets and produced at least one function required by your use-case. Note, however, that functions are not a requirement to create workflows, but without them, workflows do little other than move data around.
To create a workflow, go the the workflows tab of the Numbrz application and click the '+' in the lower right corner. You will be prompted to give your workflow a name and to select its Input Dataset. Click Create to display the workflow builder.
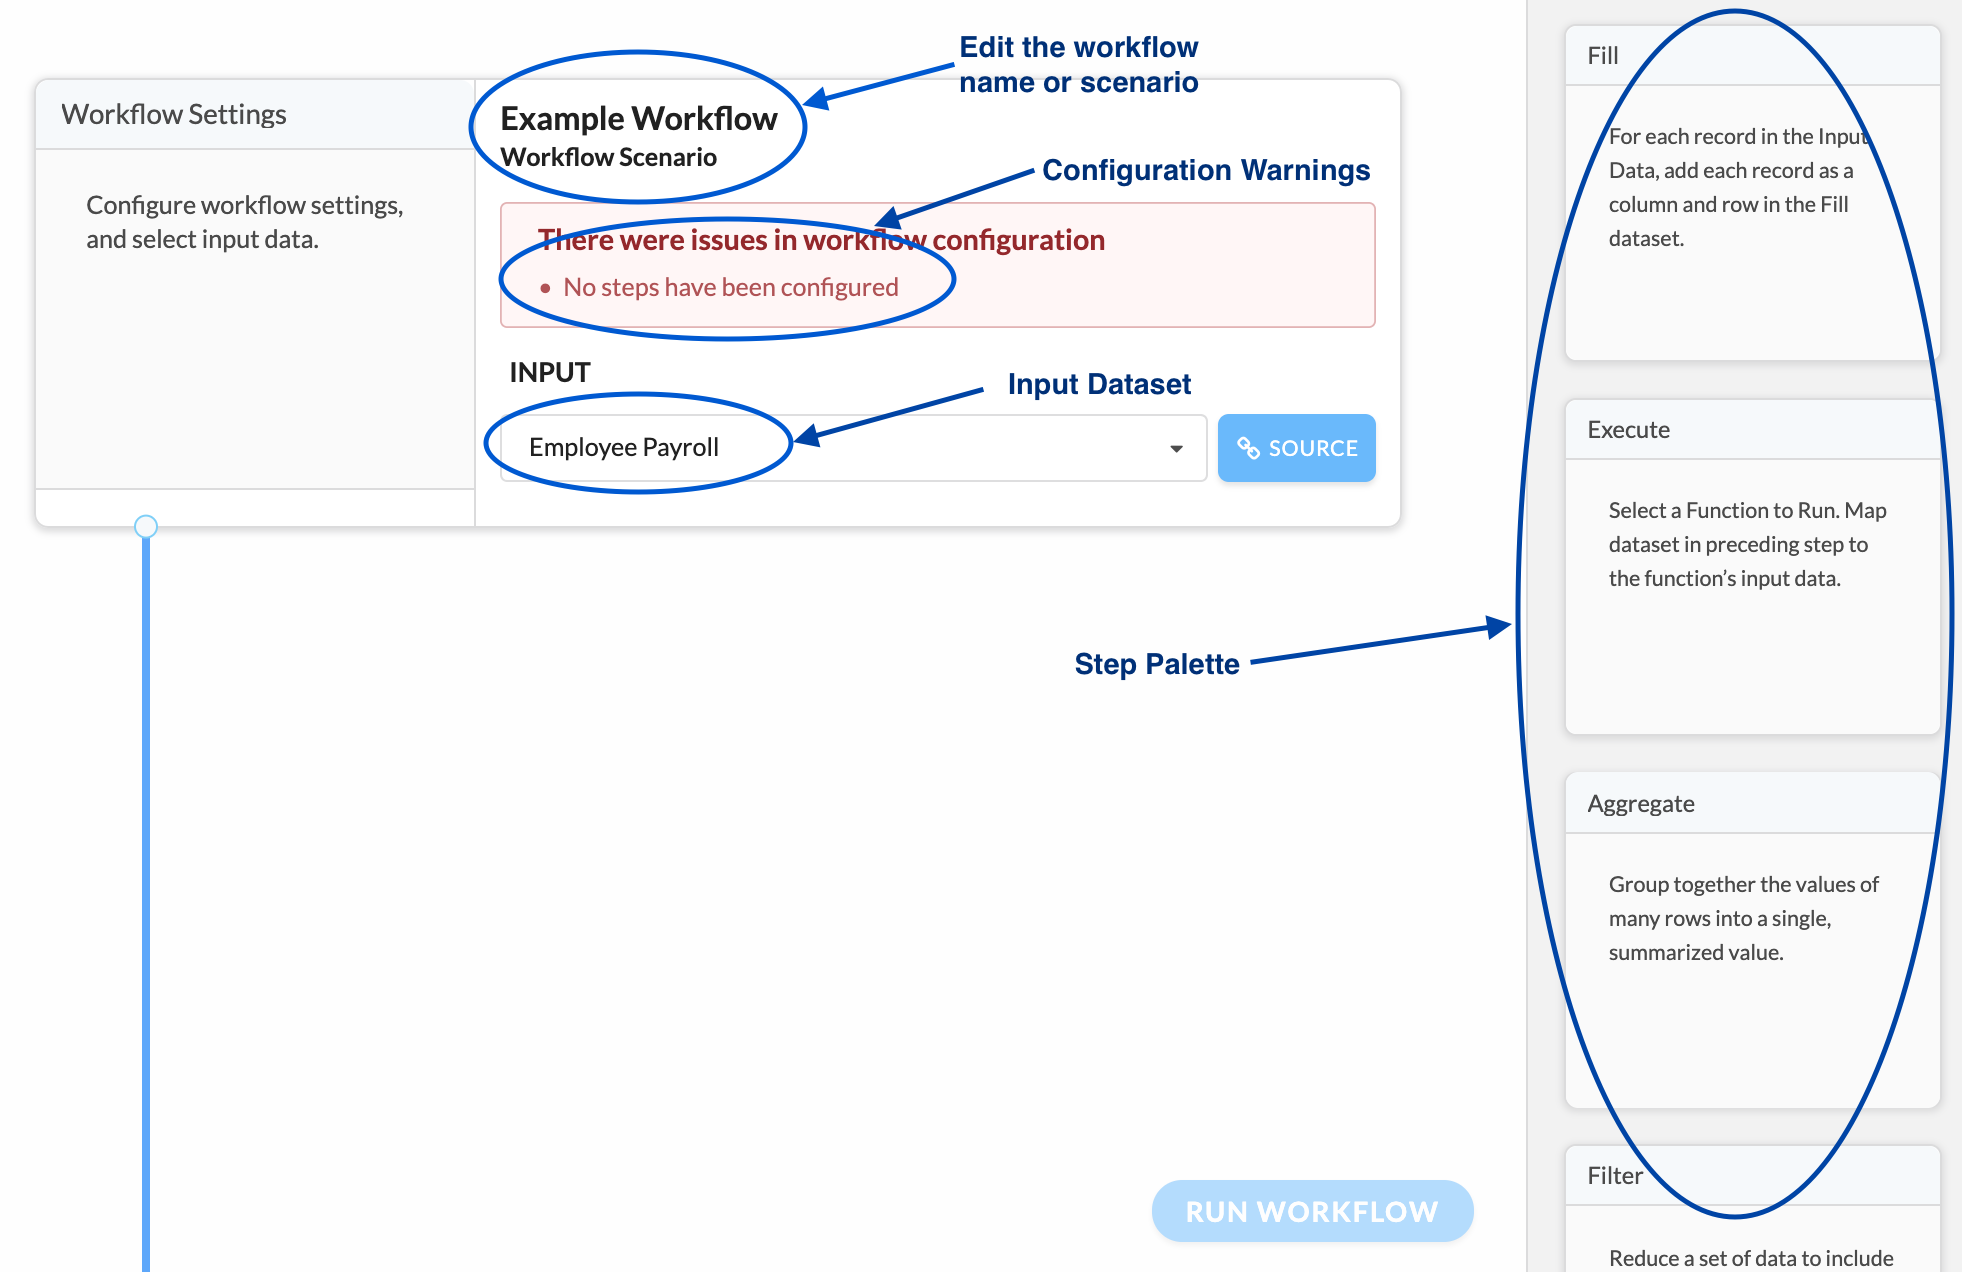
From this point on, building a workflow is simply a matter of configuring its steps. To add steps to a workflow, select the desired step type from the palette and drag it into the position desired. Steps execute in sequence, and the order they run is the order you see them in the workflow builder.
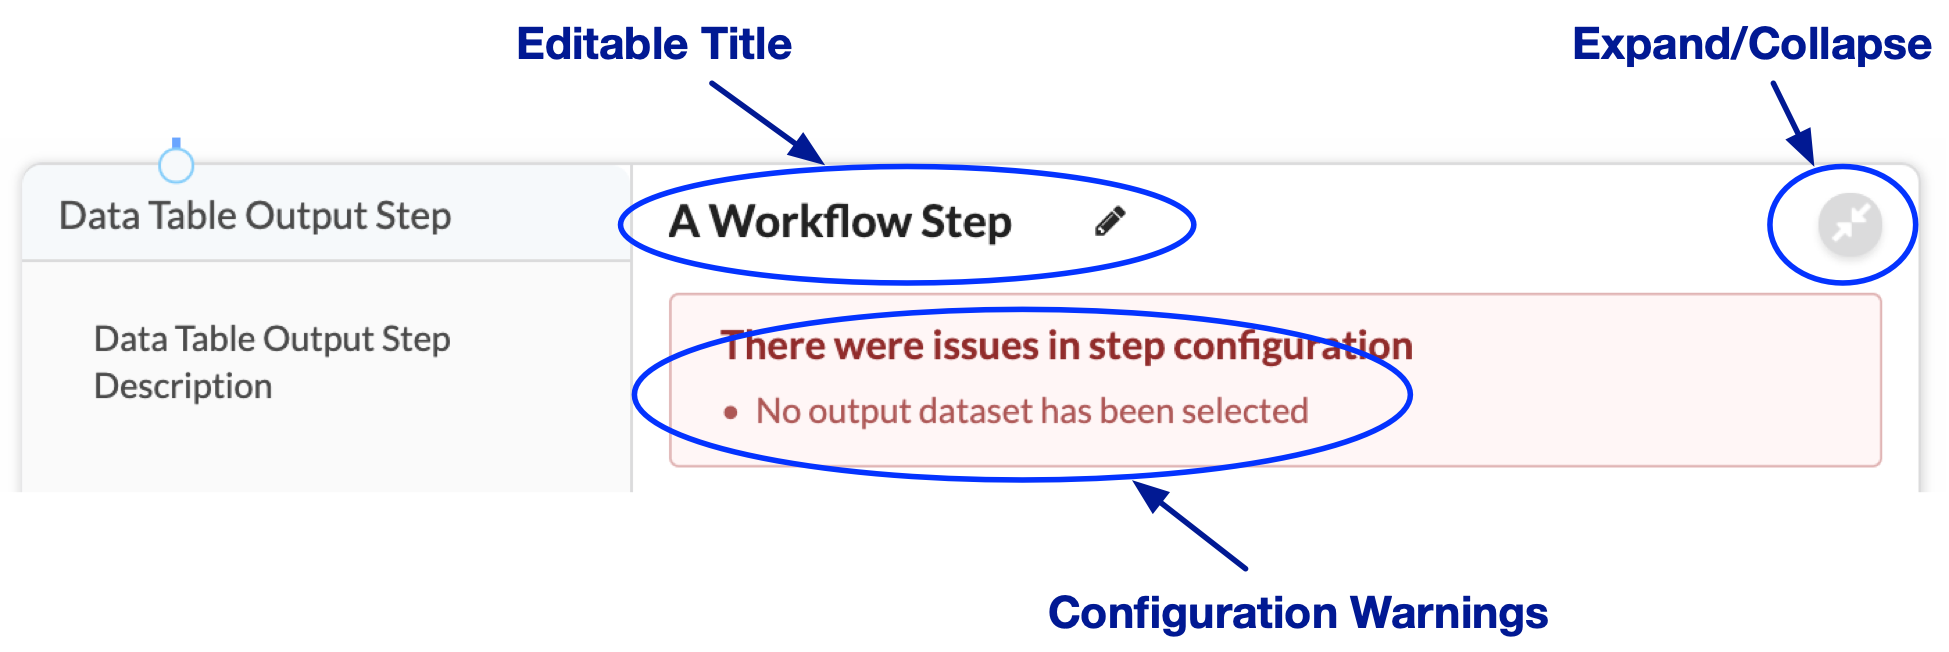
Steps displayed in the workflow share some common controls shown in the image below. You may edit the steps title. It is recommended that all your steps have a descriptive title. You can also collapse the steps configuration, making more room on the screen. Finally, if there are errors in a steps configuration, they will be displayed as a warning. Workflows with unresolved configuration warnings will not run.
In the sections that follow, each of the available workflow steps are documented in detail.
Workflow Steps
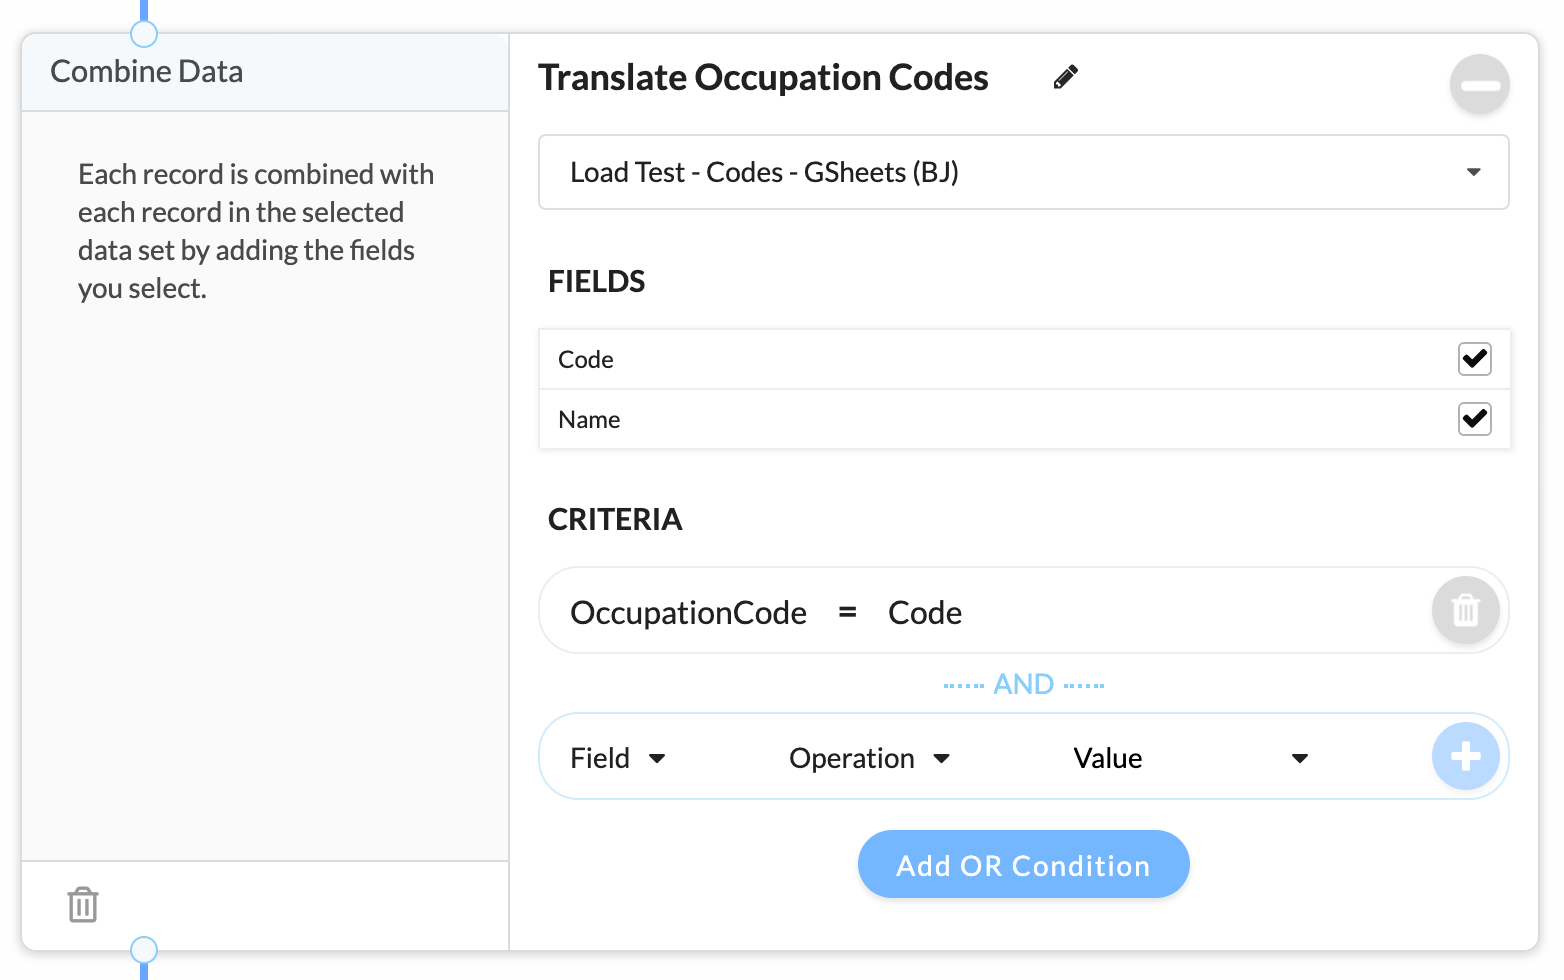
Combine Data
The Combine step combines rows from the input dataset with rows from a secondary dataset to produce a cross-join of the two datasets. In other words, for each row of input, the combine step emits rows that combine the data of the input row with the data of each row of the combine dataset. If the combine dataset consists of 10 rows, then for every input row, 10 rows are emitted. combine steps are often used to augment input with a calendar of dates, for time-based processing.
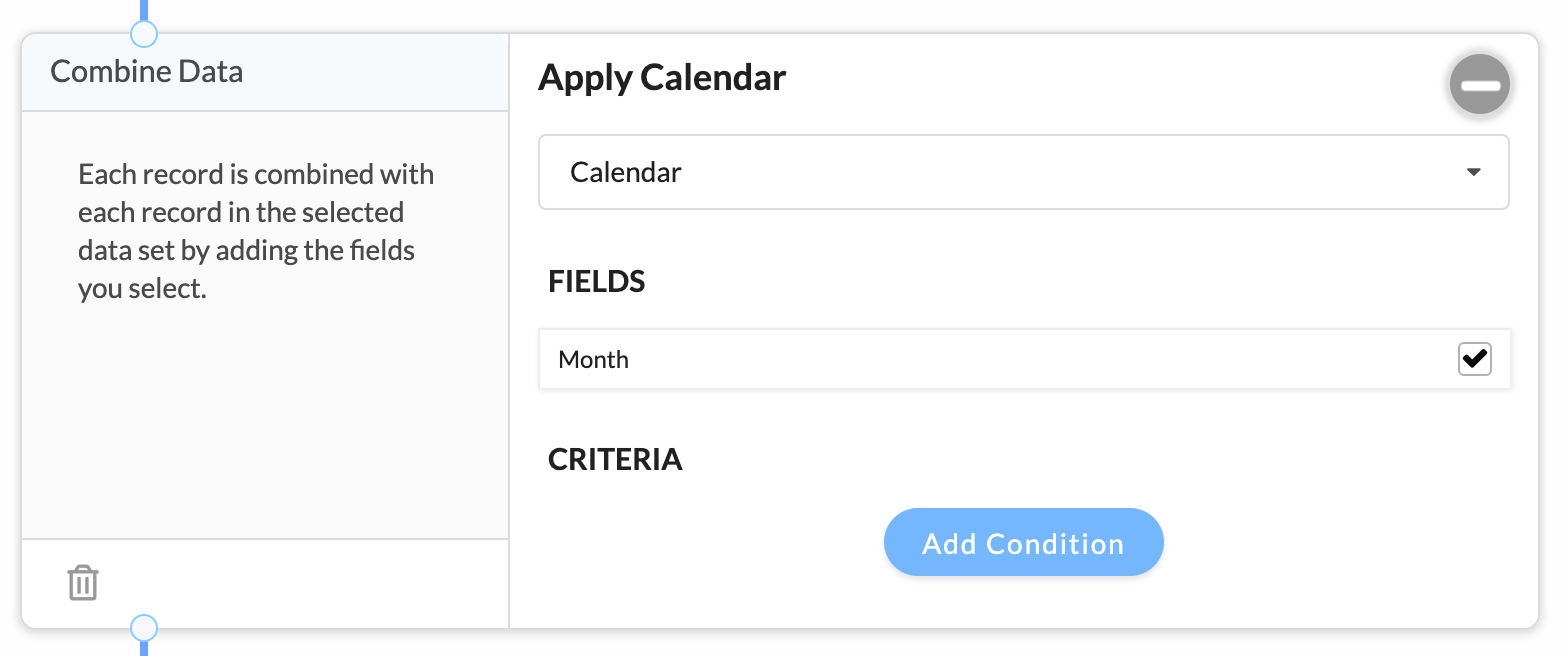
To configure a combine step, drag the combine icon from the palette and place it in your workflow. Select the combine dataset from the Select Dataset drop-down menu. In the resulting field list, check the fields you want to include in the row this step will emit.
Performing Simple "Joins" with the Combine Step
You can use Criteria to restrict what rows will be combined. For example,
if you have input data with numeric codes, and another dataset that relates these
codes to friendly names, you can restrict the combination to only those rows where
the codes in these two datasets are equal.
Execute Function
The Execute Function step uses data from the input rows to run a Numbrz Function. The step allows the user to map data elements to the functions inputs. When the workflow runs the function is executed and the results (as defined by the functions outputs) are added to the data row emitted from the step. Workflow authors can leverage the accumulation of results to chain function calls, allowing subsequent executions to build on the results of prior executions.
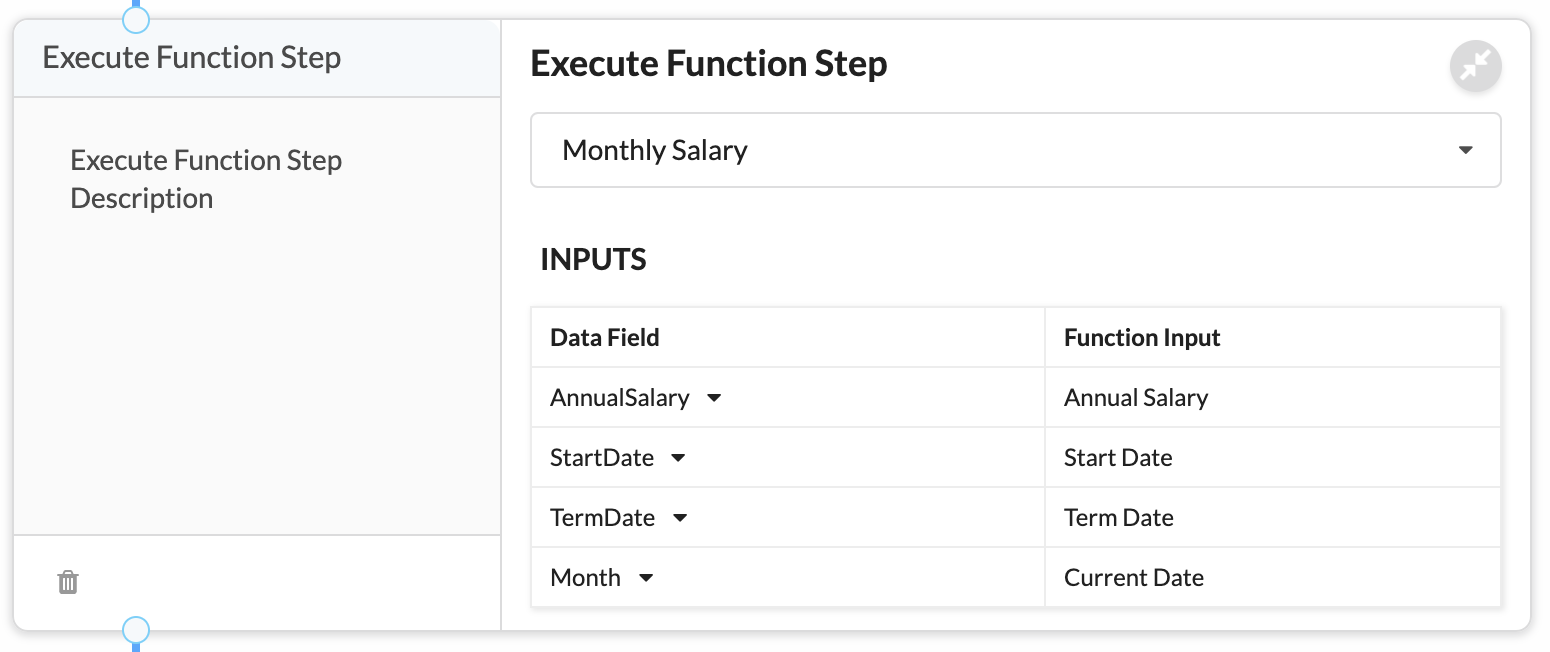
To configure the execute step, drag the execute icon from the palette and place it in your workflow. Use the Select Function drop-down menu to choose the desired function, then map data elements to the functions inputs. All the function outputs will automatically be available after execution.
Aggregate
The Aggregate step sums values in input rows according to a defined grouping. The aggregate step is a step that both substantially changes the values in the data rows it emits, as well as collapsing the number of data rows emitted.
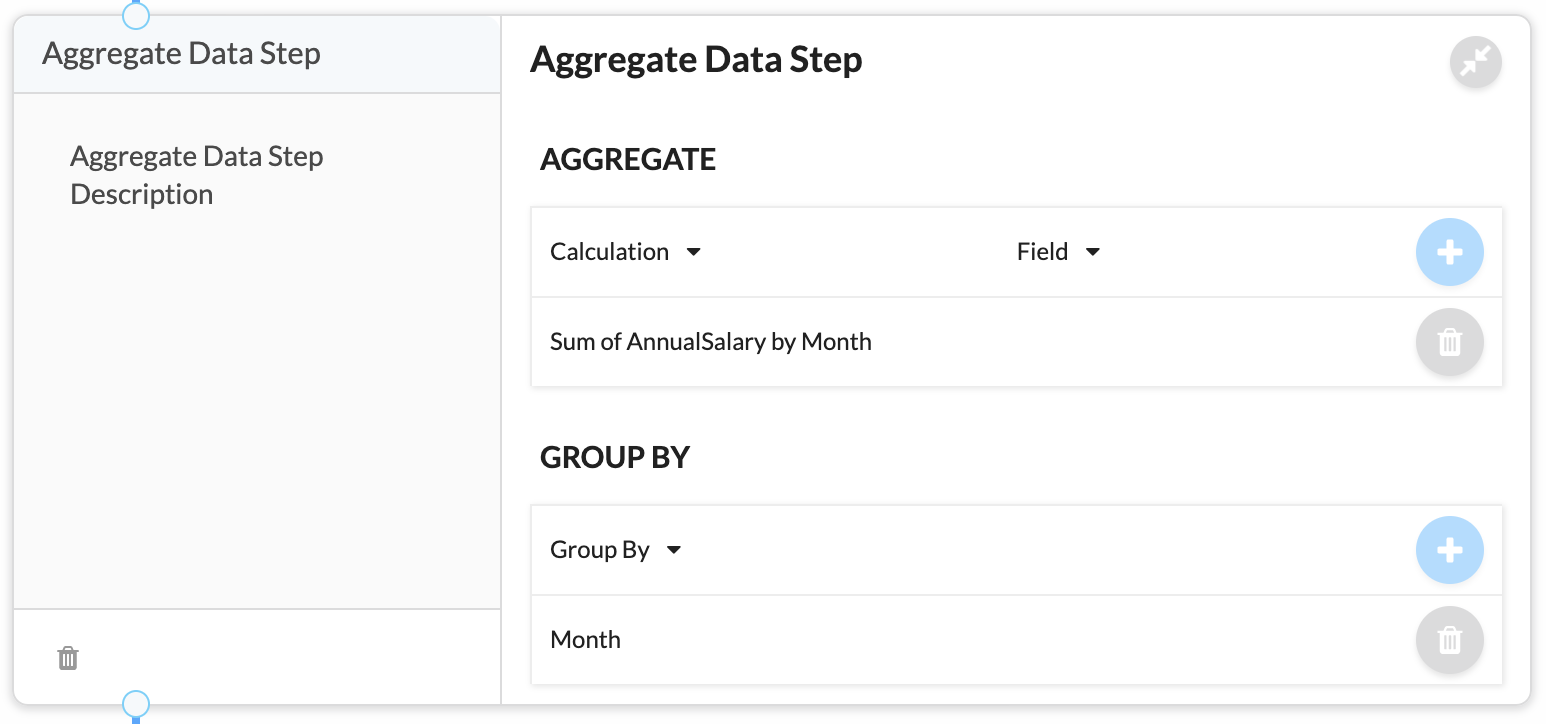
To configure the aggregate step, drag the aggregate icon from the palette and place it in your workflow. Add calculated fields using the Calculation and Field drop-down menus. Add the calculation by clicking '+'. You may repeat this process for additional calculated fields. Finally, add at least one grouping using the Group by drop-down menu, click '+' to add the grouping.
Filter
The Filter step will potentially reduce the number of rows emitted by passing the row through a user-definable filter. Only rows that meet the criteria specified by the filter will pass through the step. The filter step does not change the individual values in the row in any way.
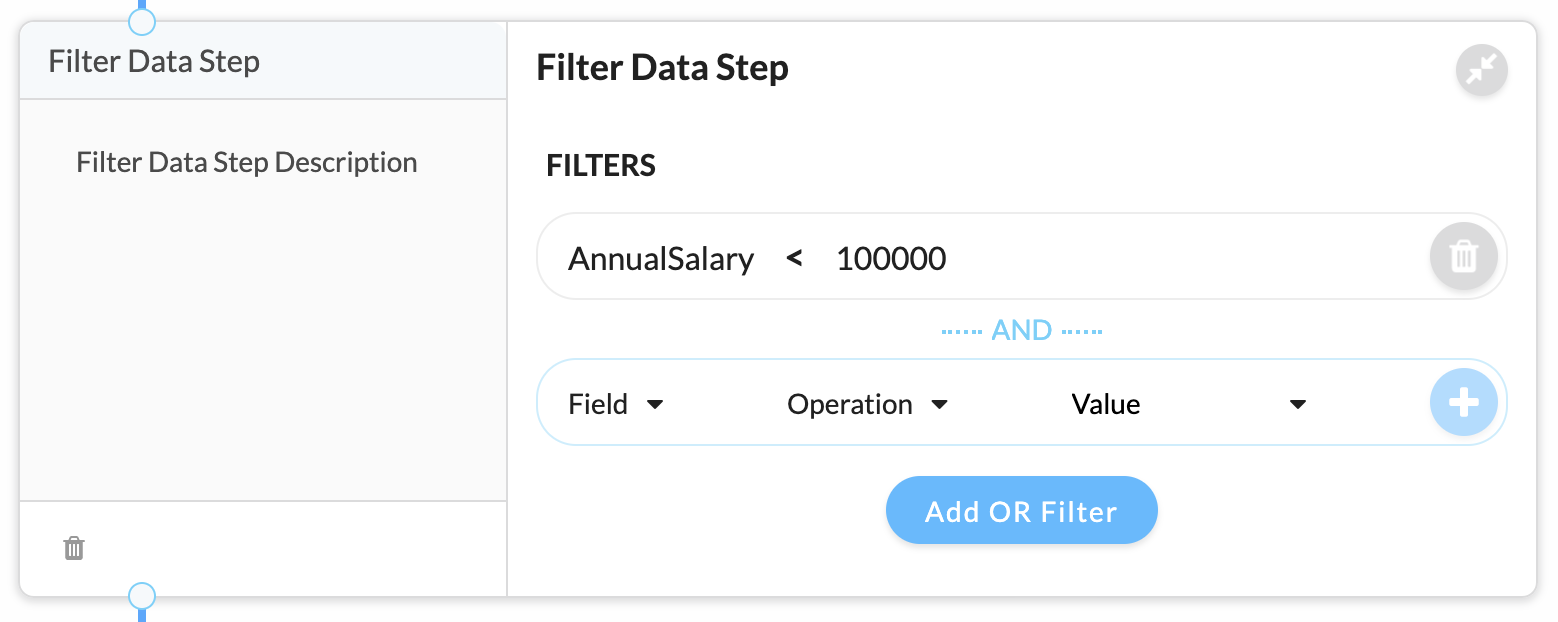
To configure the filter step, drag the filter icon from the palette and place it in your workflow. The criteria you add to filters can compare data values to a user-entered value, or to the values of other data in the row. Add criteria to the filter by clicking Add Filter and:
- selecting a data element using the Field drop-down menu.
- selecting an comparison using the Operation drop-down menu.
- entering a value or selecting a data element to compare with.
- Clicking the '+' to add your criteria.
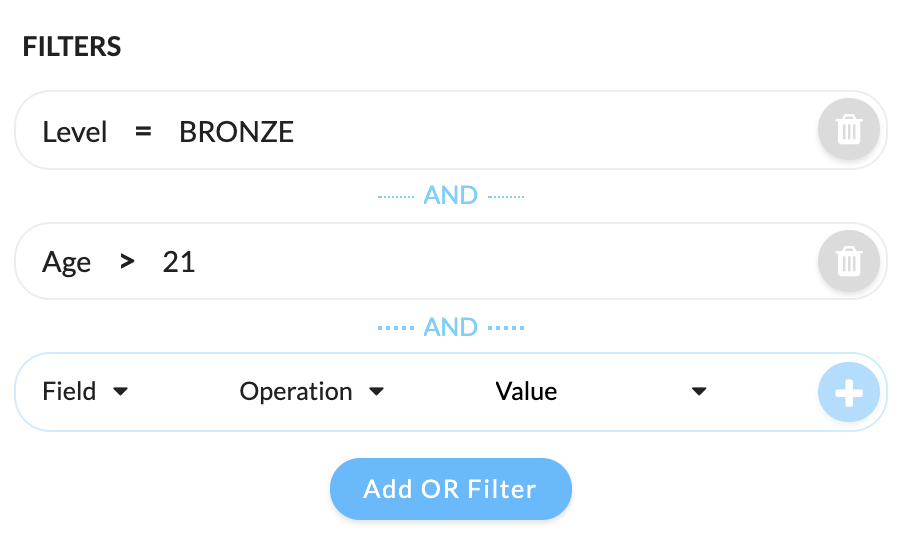
You may repeat the process above for as many fields as you wish. When you create criteria this way, all of the comparisons must be true for the row to pass the filter. In the example below the Level must be Bronze AND the Age must be over 21.
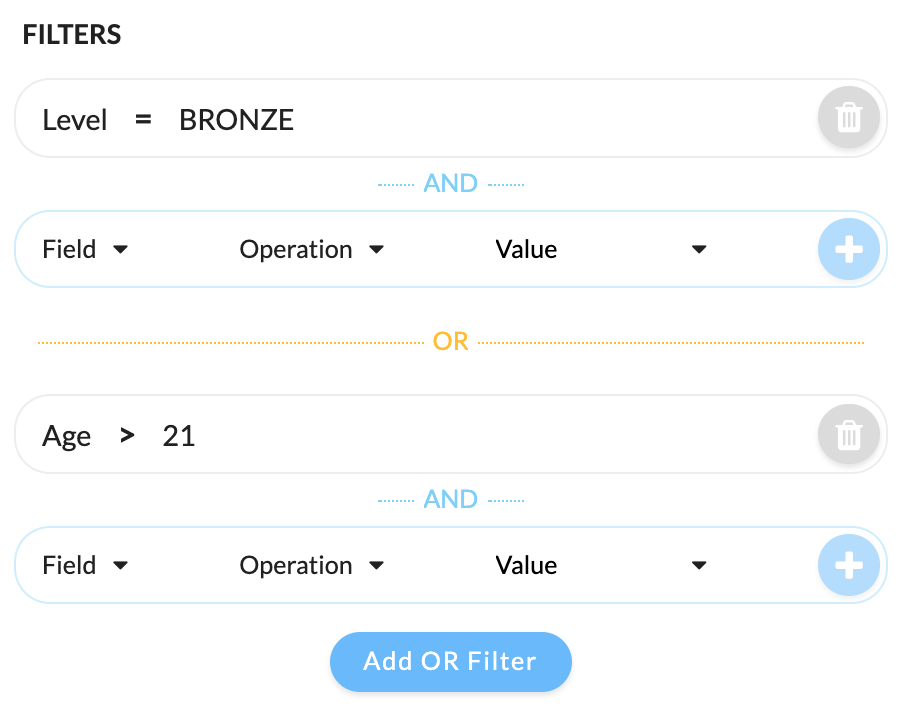
You can also create multi-condition filters where any of the criteria may be true for the row to pass. To do this, add your first criteria as described above, then click Add OR Filter. Add your criteria using the drop-down menus and clicking '+' also as described above. In the example below, the Level must be Bronze OR the Age must be over 21.
Output
The Output step writes data to a Numbrz dataset. During step configuration, elements of the data rows passing through the step are mapped to fields in the dataset. Output steps still pass the data to downstream steps, allowing outputs to be chained in interesting ways. The output step does not change the individual values in the row in any way.
To configure the output step, drag the output icon from the palette and place it in your workflow. Use the Select Dataset drop-down menu to select the dataset you want to write to. Then map the workflow data fields to their respective dataset fields.
The output step also supports these additional features:
- An optional filter that controls what data will be written to the output dataset. All data rows still pass through the step to any following steps. Configuring the filter works just like in the Filter step.
- the Skip Step checkbox which allows you to suspend writing to the target dataset when checked. All data rows still pass through the step to any following steps.
AWS Output
The AWS Output step writes data to Amazon S3 as CSV. During step configuration, elements of the data rows passing through the step are mapped to fields in a delimited file. Output steps still pass the data to downstream steps, allowing outputs to be chained in interesting ways. The output step does not change the individual values in the row in any way.
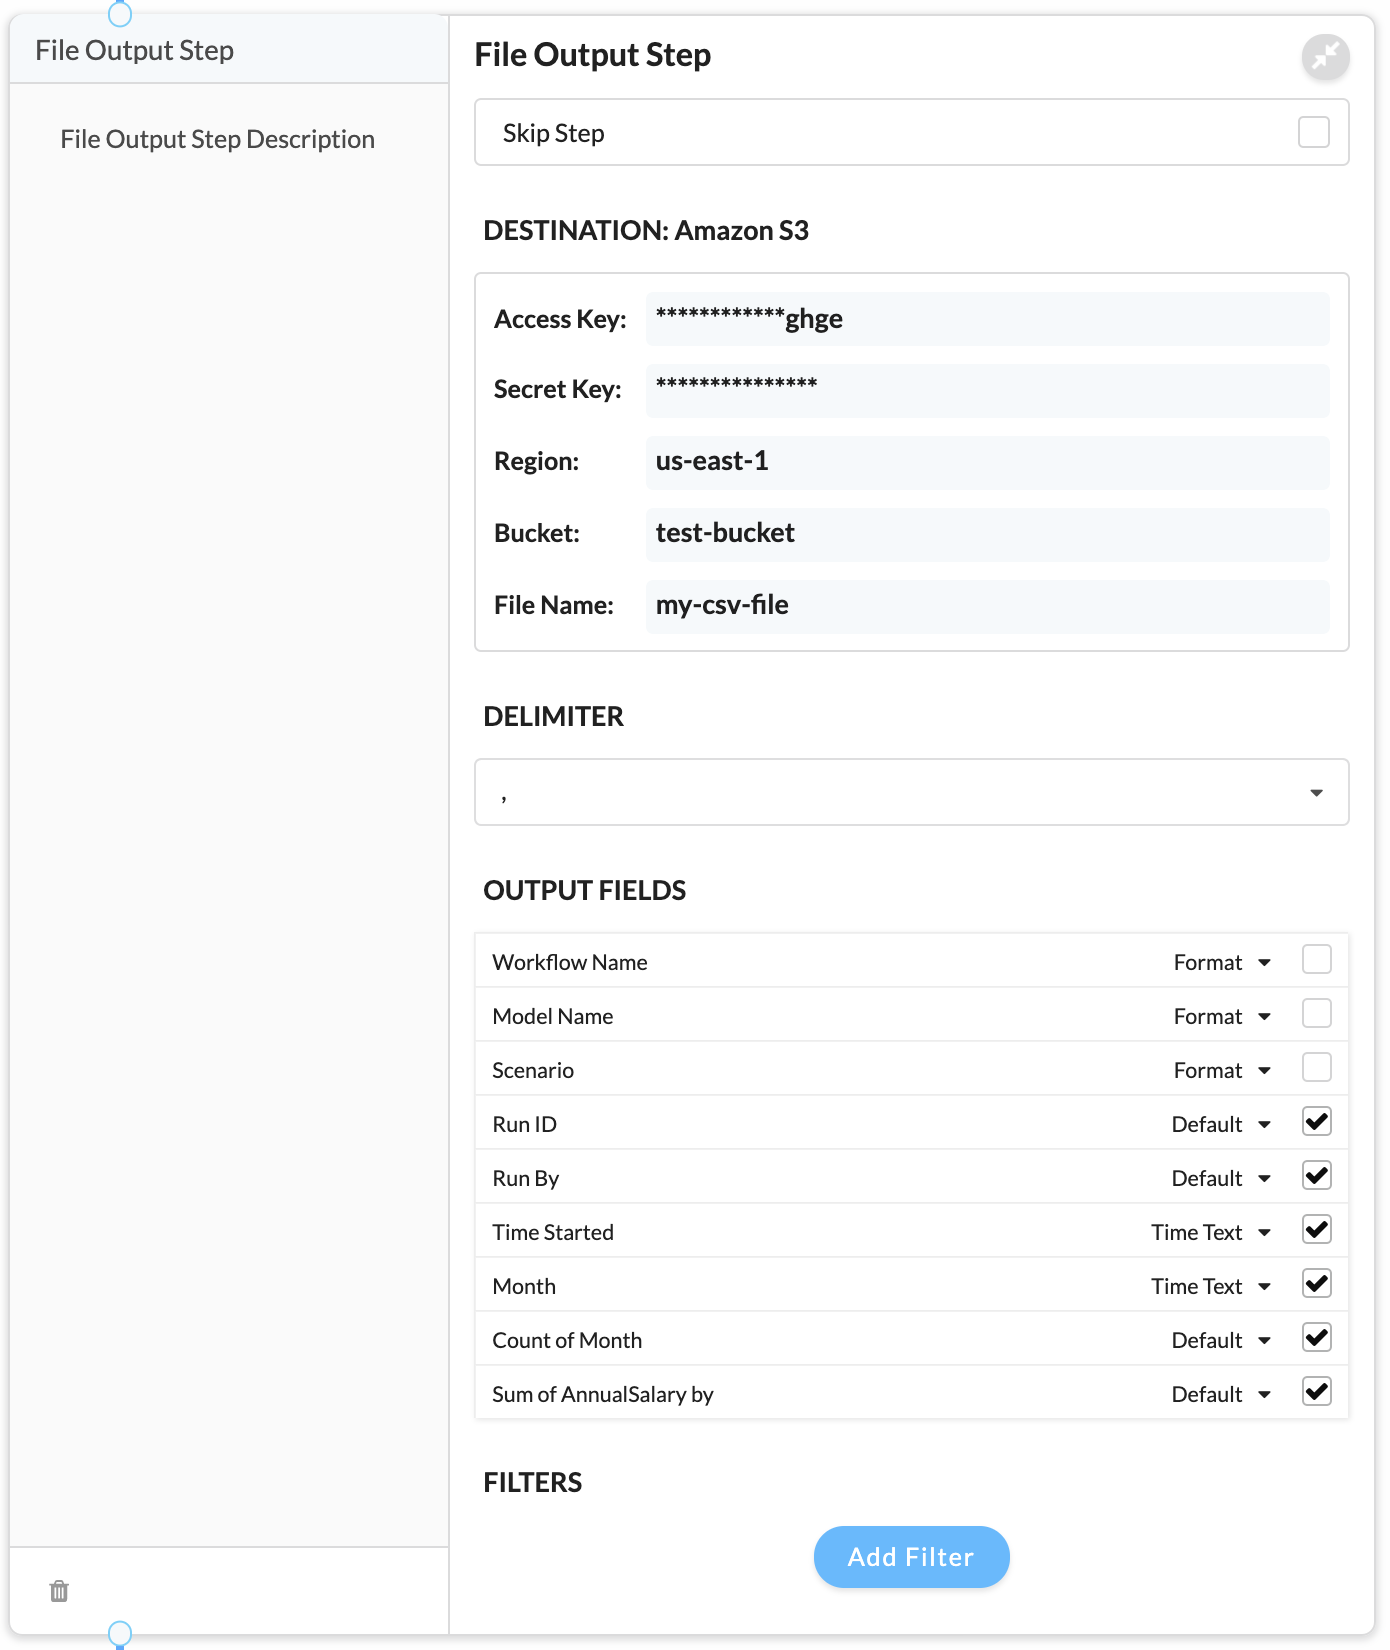
To configure the AWS output step, drag the AWS output icon from the palette and place it in your workflow. You will need some information about your AWS deployment, as well as API credentials in order to connect to S3. Your AWS administrator may need to assist you in obtaining this information. Enter:
- Access Key - first part of credentials for Amazon S3
- Secret Key - second part of credentials for Amazon S3
- Region Code - the AWS region in which your S3 bucket is located
- Bucket Name = the name of the S3 bucket you want to save to
- File Name - the file name
Once the S3 information above has been completed, select the data elements you wish to include in the file by clicking the checkbox next to the element name. Note the Format drop-down menu, at this time, changing formats is supported for date type fields, for date fields, selecting a format of Time Text is recommended for most cases.
S3 File Names
You may use S3 path separator characters in the file name to place your files in
a folder hierarchy. You can create dynamic file names using variable replacement.
Variables take the form: $variable_name. The following variable may be used in file
names:
- $jobname - the name of the workflow
- $scenario - the value of the Scenario name given to workflow
- $runid - the unique execution identifier for the current workflow run
- $runby - the name of the user who executed the workflow
- $started - the timestamp (in numeric form) of the workflow execution
The AWS output step also supports these additional features:
- The ability to change the field delimiter in the output file, ',' is the default.
- An optional filter that controls what data will be written to the output file. All data rows still pass through the step to any following steps. Configuring the filter works just like in the Filter step.
- the Skip Step checkbox which allows you to suspend writing to the target file when checked. All data rows still pass through the step to any following steps.
Running Workflows
To run your workflow, open it from the Workflows list and click the Run Workflow button in the lower right corner. A status screen will be displayed. Note that workflows execute in the Numbrz system as background tasks, so you do not need to wait on the status screen for the workflow to complete.

Depending upon how long the workflow takes to complete, the status page may display different information. All workflows go through the following phases:
- Queued - the workflow run request is received, and the workflow is awaiting execution.
- Running - the workflow is processing, you will see per-step totals begin to increment.
- Completed - the workflow has finished running.
Workflows may also display a Failed status. This status will be accompanied by additional messages describing the problem.
If there is a problem with the workflow or it is behaving unexpectedly, the workflow may be cancelled by clicking the Cancel Workflow button in the lower right corner of the status screen.
Projects
Overview
Numbrz Projects allow users to group functions, data, and workflows in one easy-to-manage place. Users can link existing artifacts or create new artifacts that will be linked to a Project upon instantiation. New or existing artifacts can be added by clicking '+' icon at the bottom right corner of the project container. The following graphic demonstrates adding a new Function to the Project:
And the following graphic shows how to add an existing Function:
Navigating between various types of articacts belonging to the project is done through use of tabbed menu located at the top of the Project container.