Headcount Tutorial
Overview
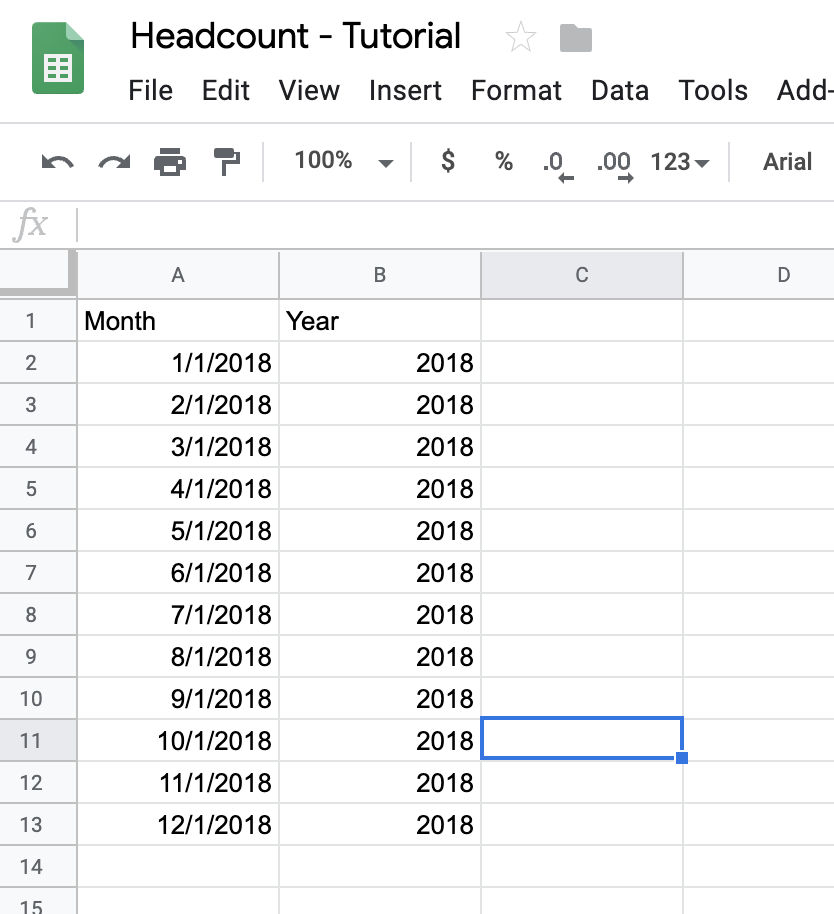
In this tutorial we will build a model which will forecast monthly salary expenses and total headcount. Our model will address a somewhat simplified version of a real-world problem that is often solved using a spreadsheet. We will process an employee table containing start and termination dates and current salaries into a series of monthly totals for planning or forecasting. Consider the spreadsheet below, which endeavors to address this case.
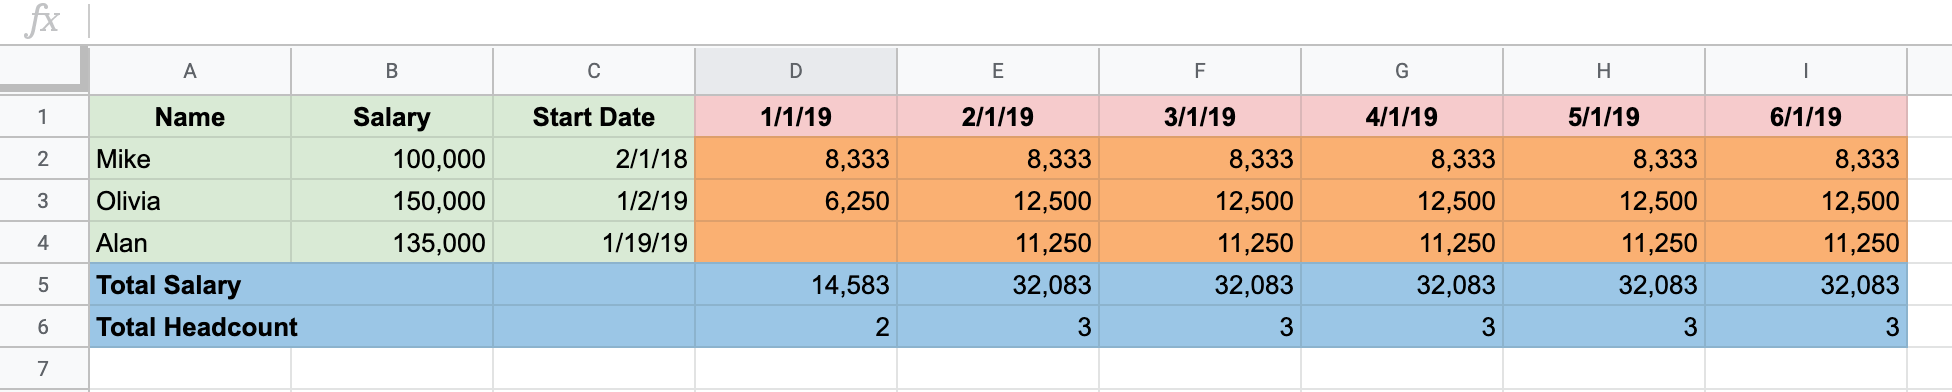
Using a spreadsheet to perform these calculations works, but has several weaknesses that become evident as the amount of data and number of calculations grows.
New data requires structural changes
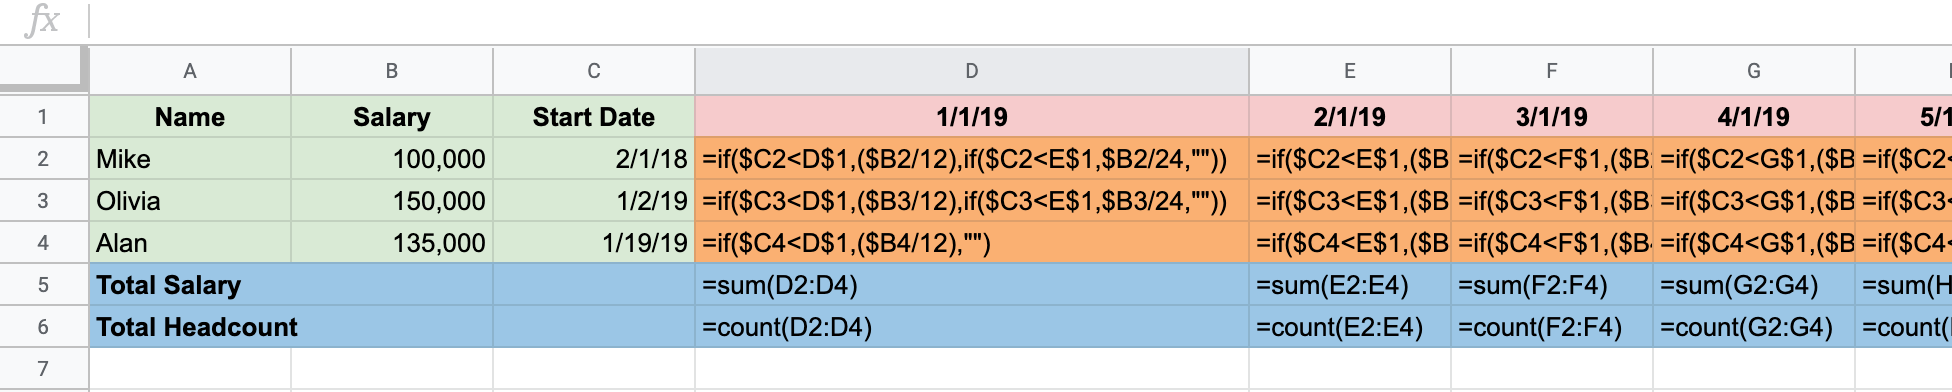
Spreadsheets may often combine data and calculations tightly. In our example, if you want to add more employees or additional forecast dates, you have to insert rows and columns and copy formulas and formats.
Formulas are difficult to follow
Even in our simplified example, it is difficult to explain and document the various formulas used. As the complexity of a spreadsheet grows, this worsens to the point that only a handful of persons in the organization may really understand what the formulas do.
Collaboration is difficult
The tight coupling of data and calculation, as well as the concentration of understanding in just a few persons make collaboration and division of tasks difficult.
Processes cannot be automated
Spreadsheets are not applications, performing any updates always requires manual work.
The Numbrz Solution
In the sections that follow, we will build a solution consisting of the following elements:
- Simple data tables representing our employee list and the calendar of dates we wish to plan or forecast. This data will not be commingled with calculations and will be easy to change regardless of how complex the overal system becomes. Indeed, persons responsible for maintaining such data can work separately from yet in collaboration with maintainers of other system components.
- An easy-to-understand function that calculates salary expense and headcount. In Numbrz, functions are clear and self-documenting, unlike formulae in spreadsheets.
- An automated workflow that uses this function to process our employee and calendar data into a destination spreadsheet that can be used for visualization and further analysis. Workflows turn data and functions into full-blown applications.
Setting Up A Project
To get started, let's create a project that will hold all of the artifacts required by our headcount workflow. Simply navigate to Projects tab if you are not already there and click '+' icon located on the bottom right corner. Title your project appropriately and click 'Add'. Now you have a place to store any number of functions, data sources, and workflows related to your headcount model. You should see a screen similar to the one below:
Setting Up Functions
Overview
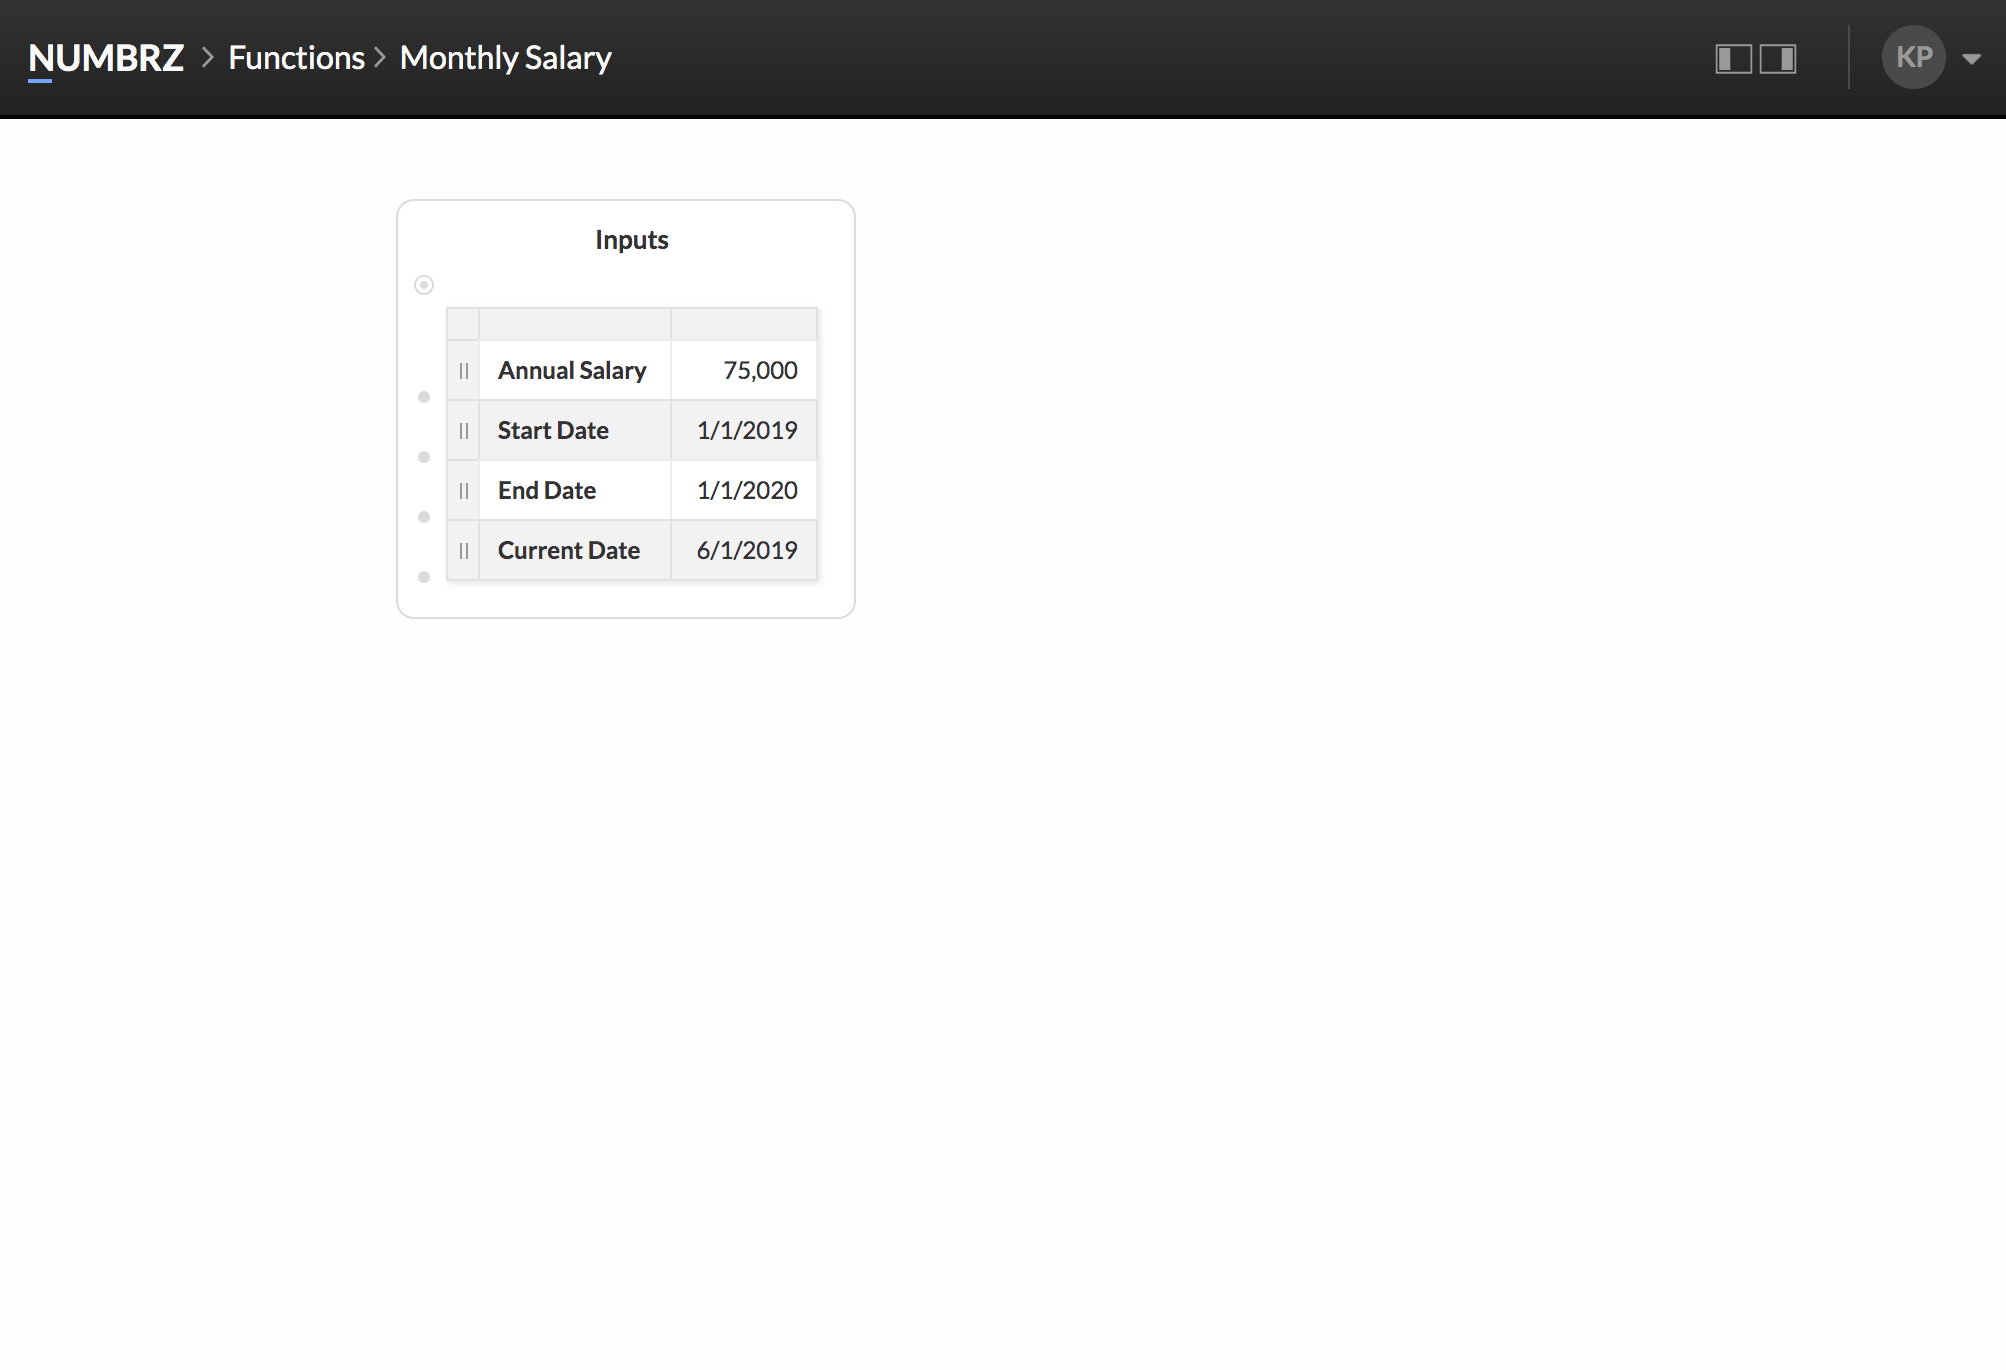
The monthly salary function will accept the following inputs:
It will produce the following outputs:
To get started, select Functions tab and click the '+' button in the lower right corner. You should see a dialog similar to the following:
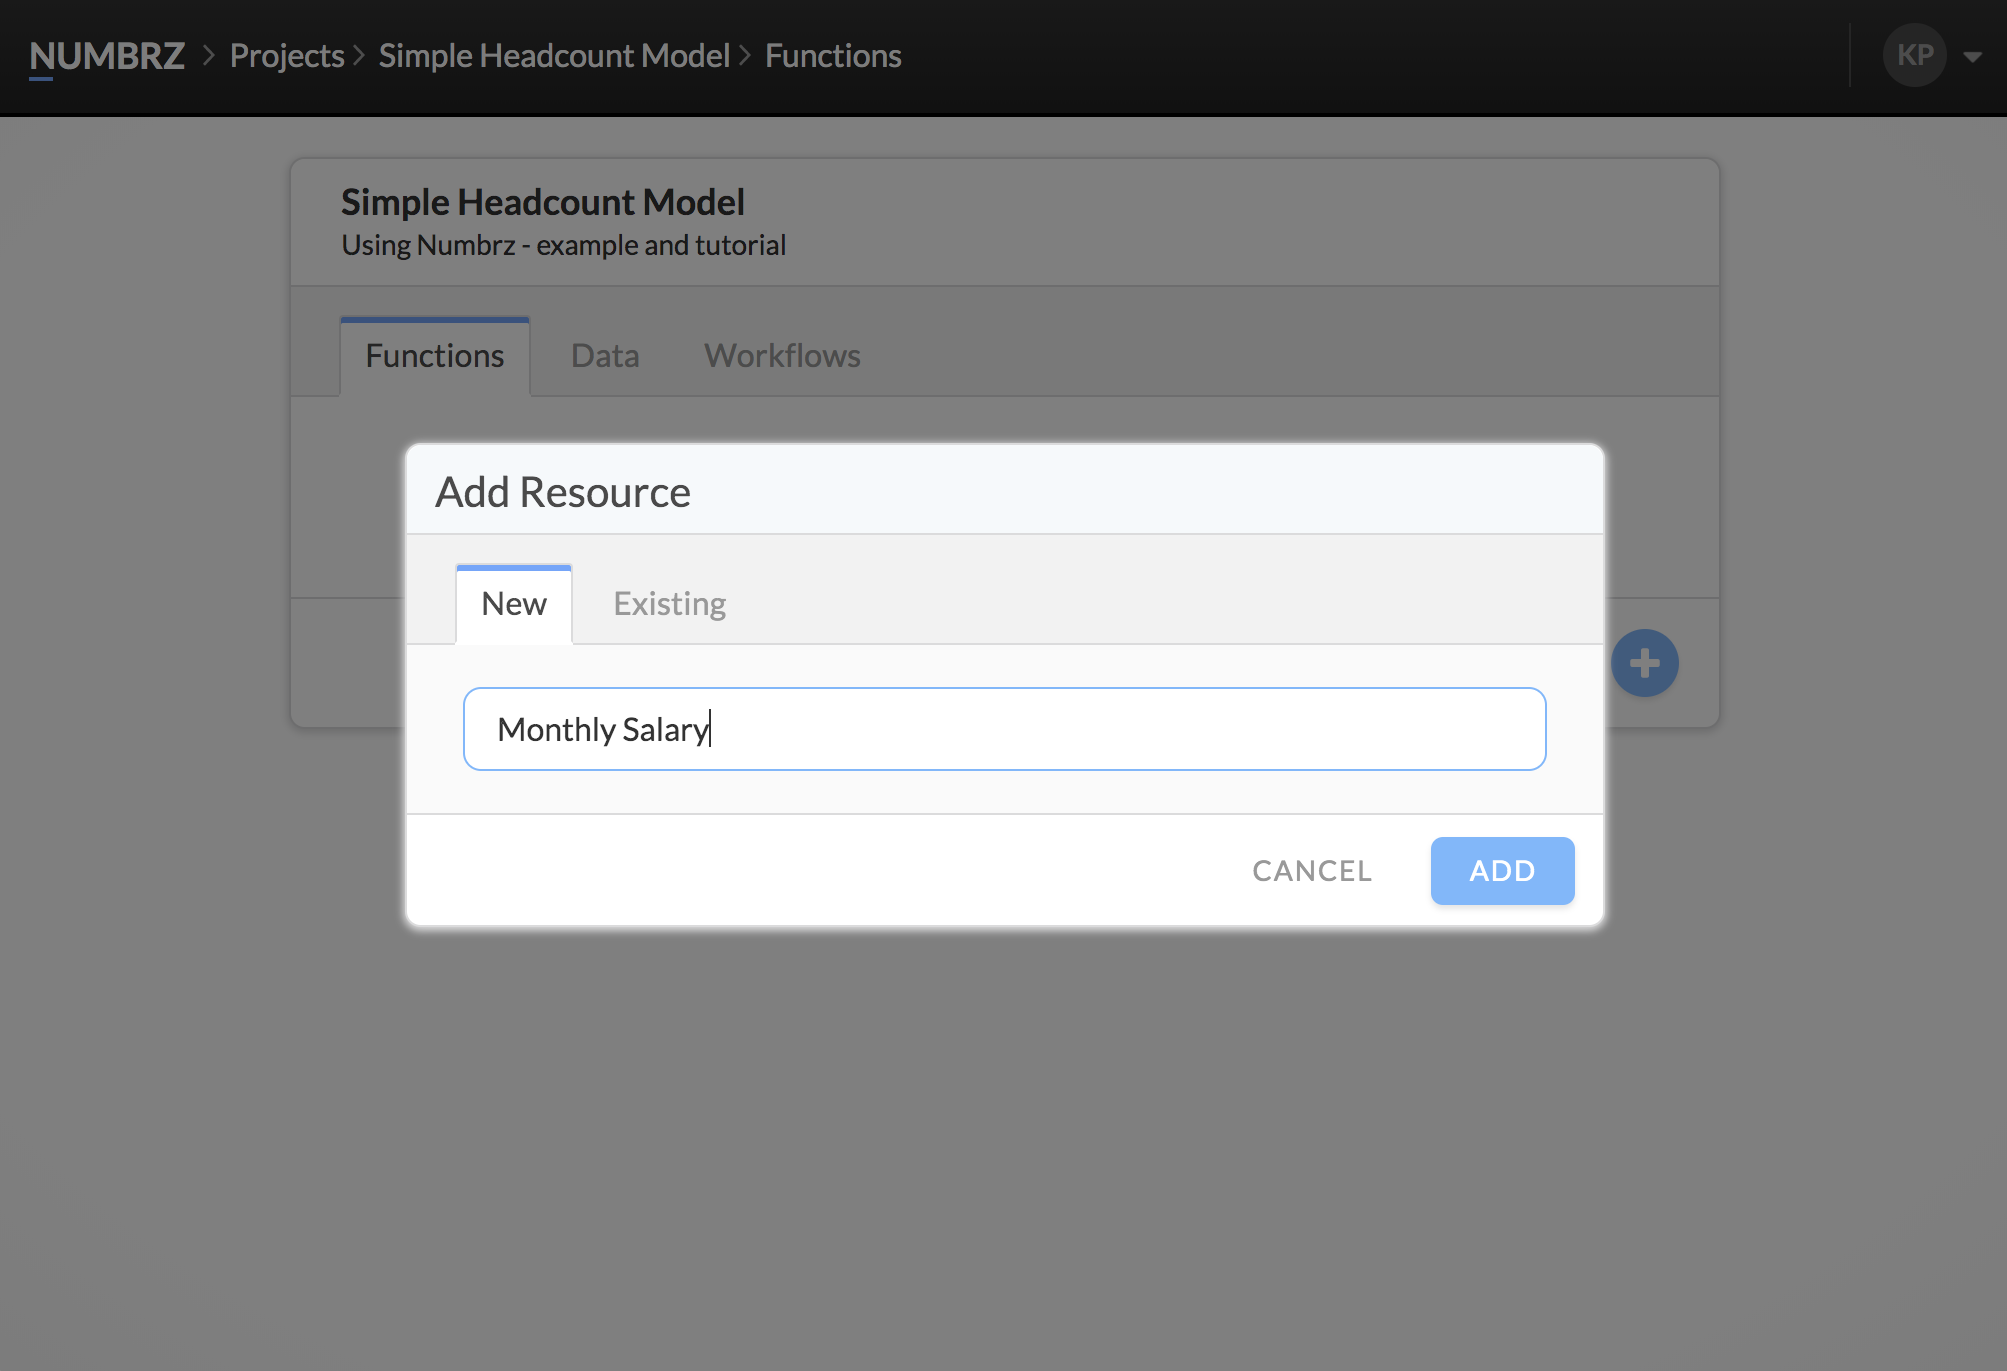
Give the function a name (Monthly Salary) and click 'Add'. This will create the function and add it to our project. Click the newly created function to open the Modeler. You should see an empty canvas:
Inputs and Outputs
First, let's add the inputs to the function. Functions accept input using an Input widget. To add one, double-click on the canvas to bring up the Add Widget dialog. The location you click will determine where the new widget will be placed. You should a dialog similar to the following:
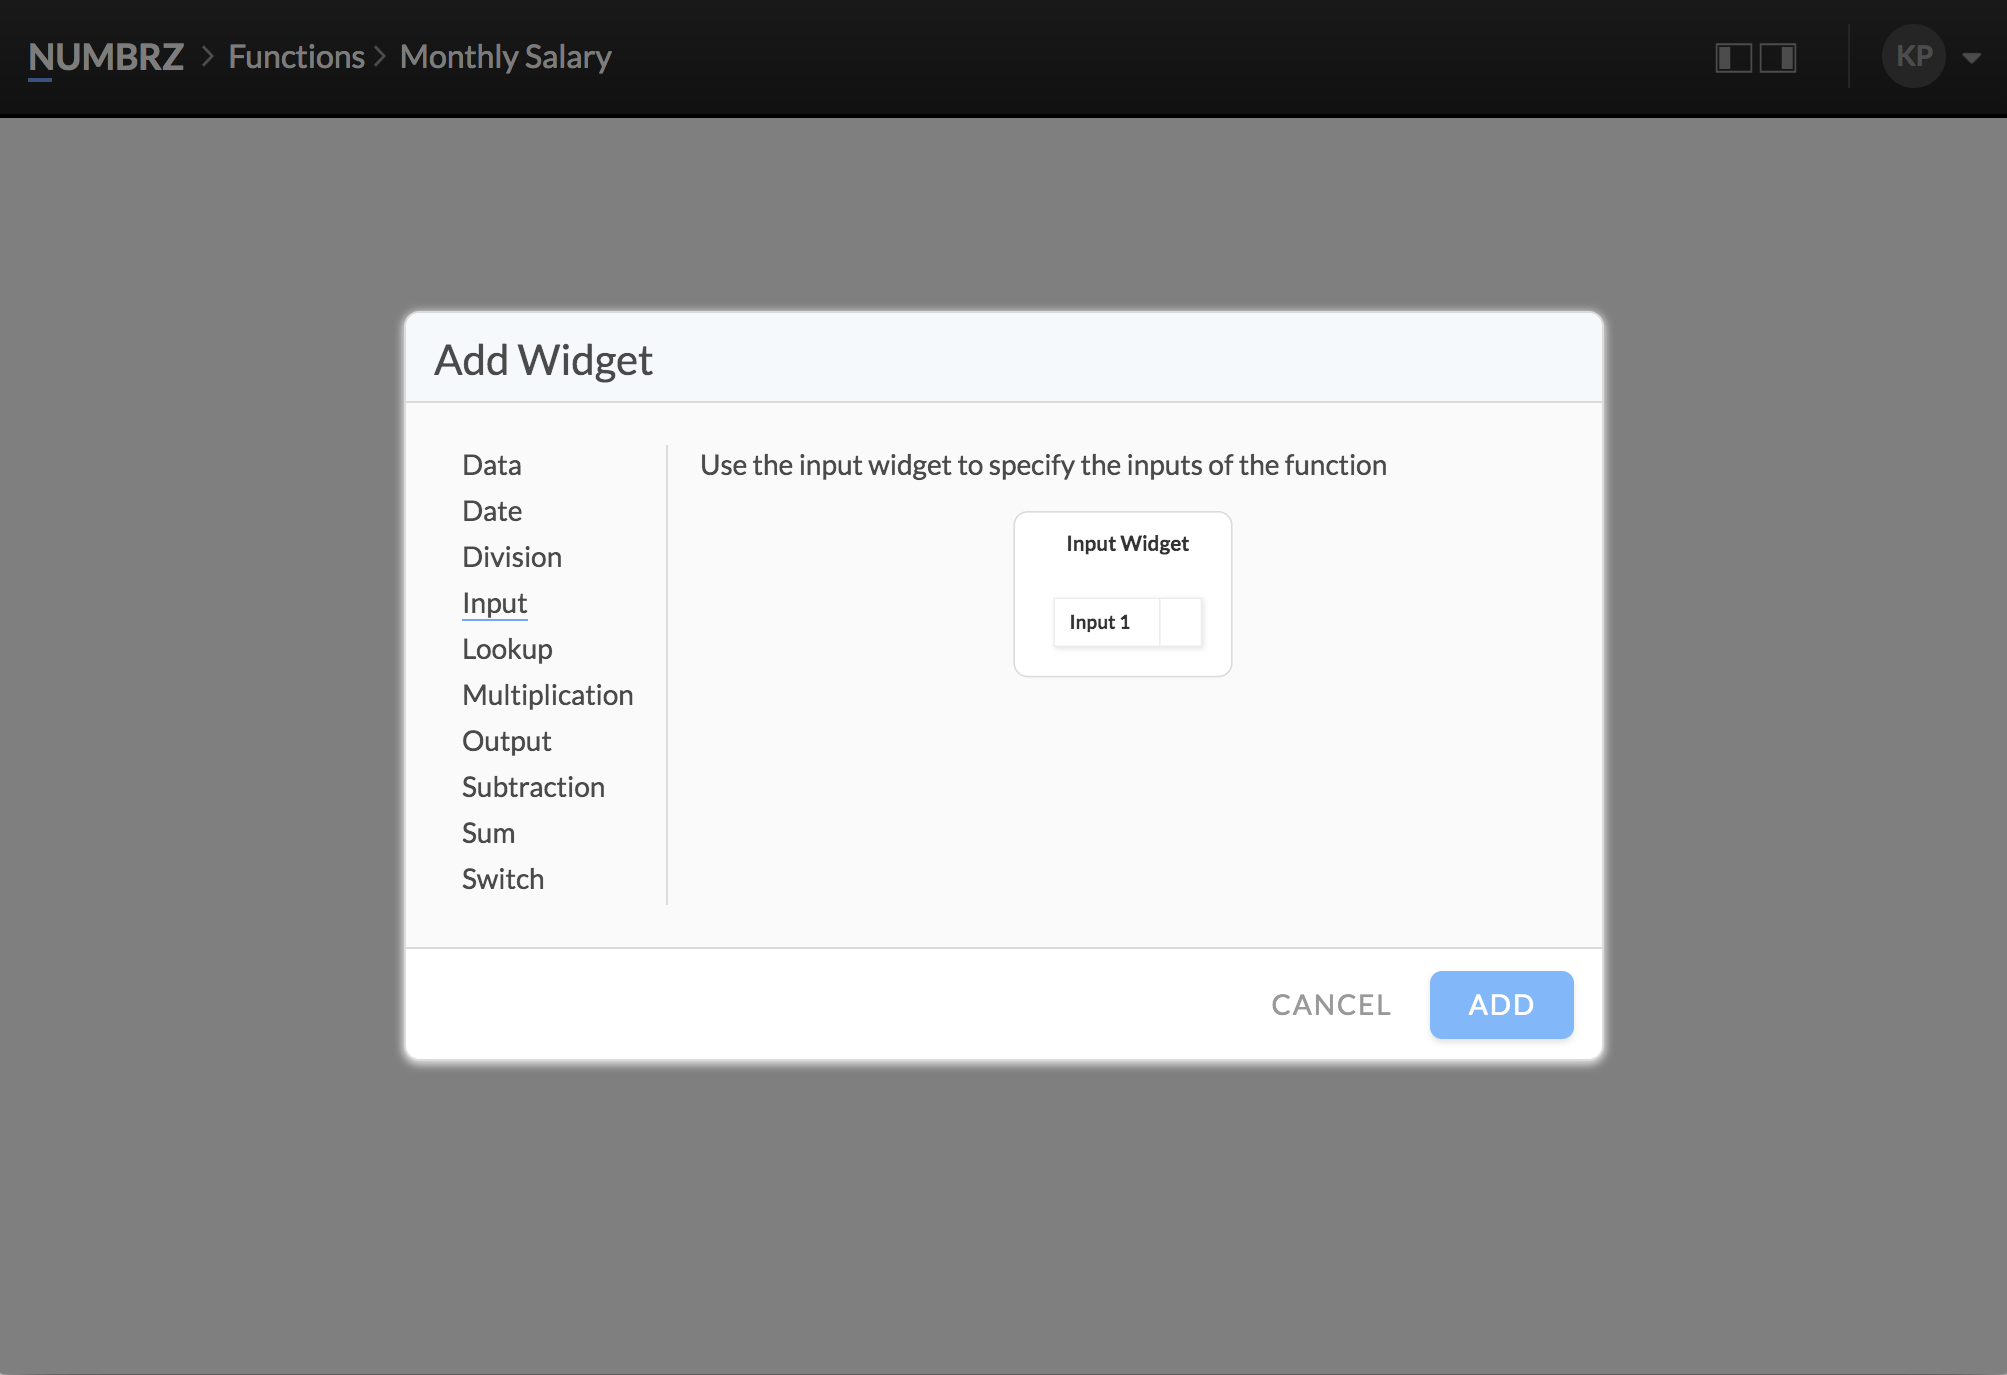
Select 'Input' from the list of widgets on the left, and click 'Add'. Congratulations, you created your first widget! You can double-click on the widget title to change the title. Next, let's add three more inputs. Rows can be added like this:
Repeat this three times to create four input rows, then add labels and enter sample values:
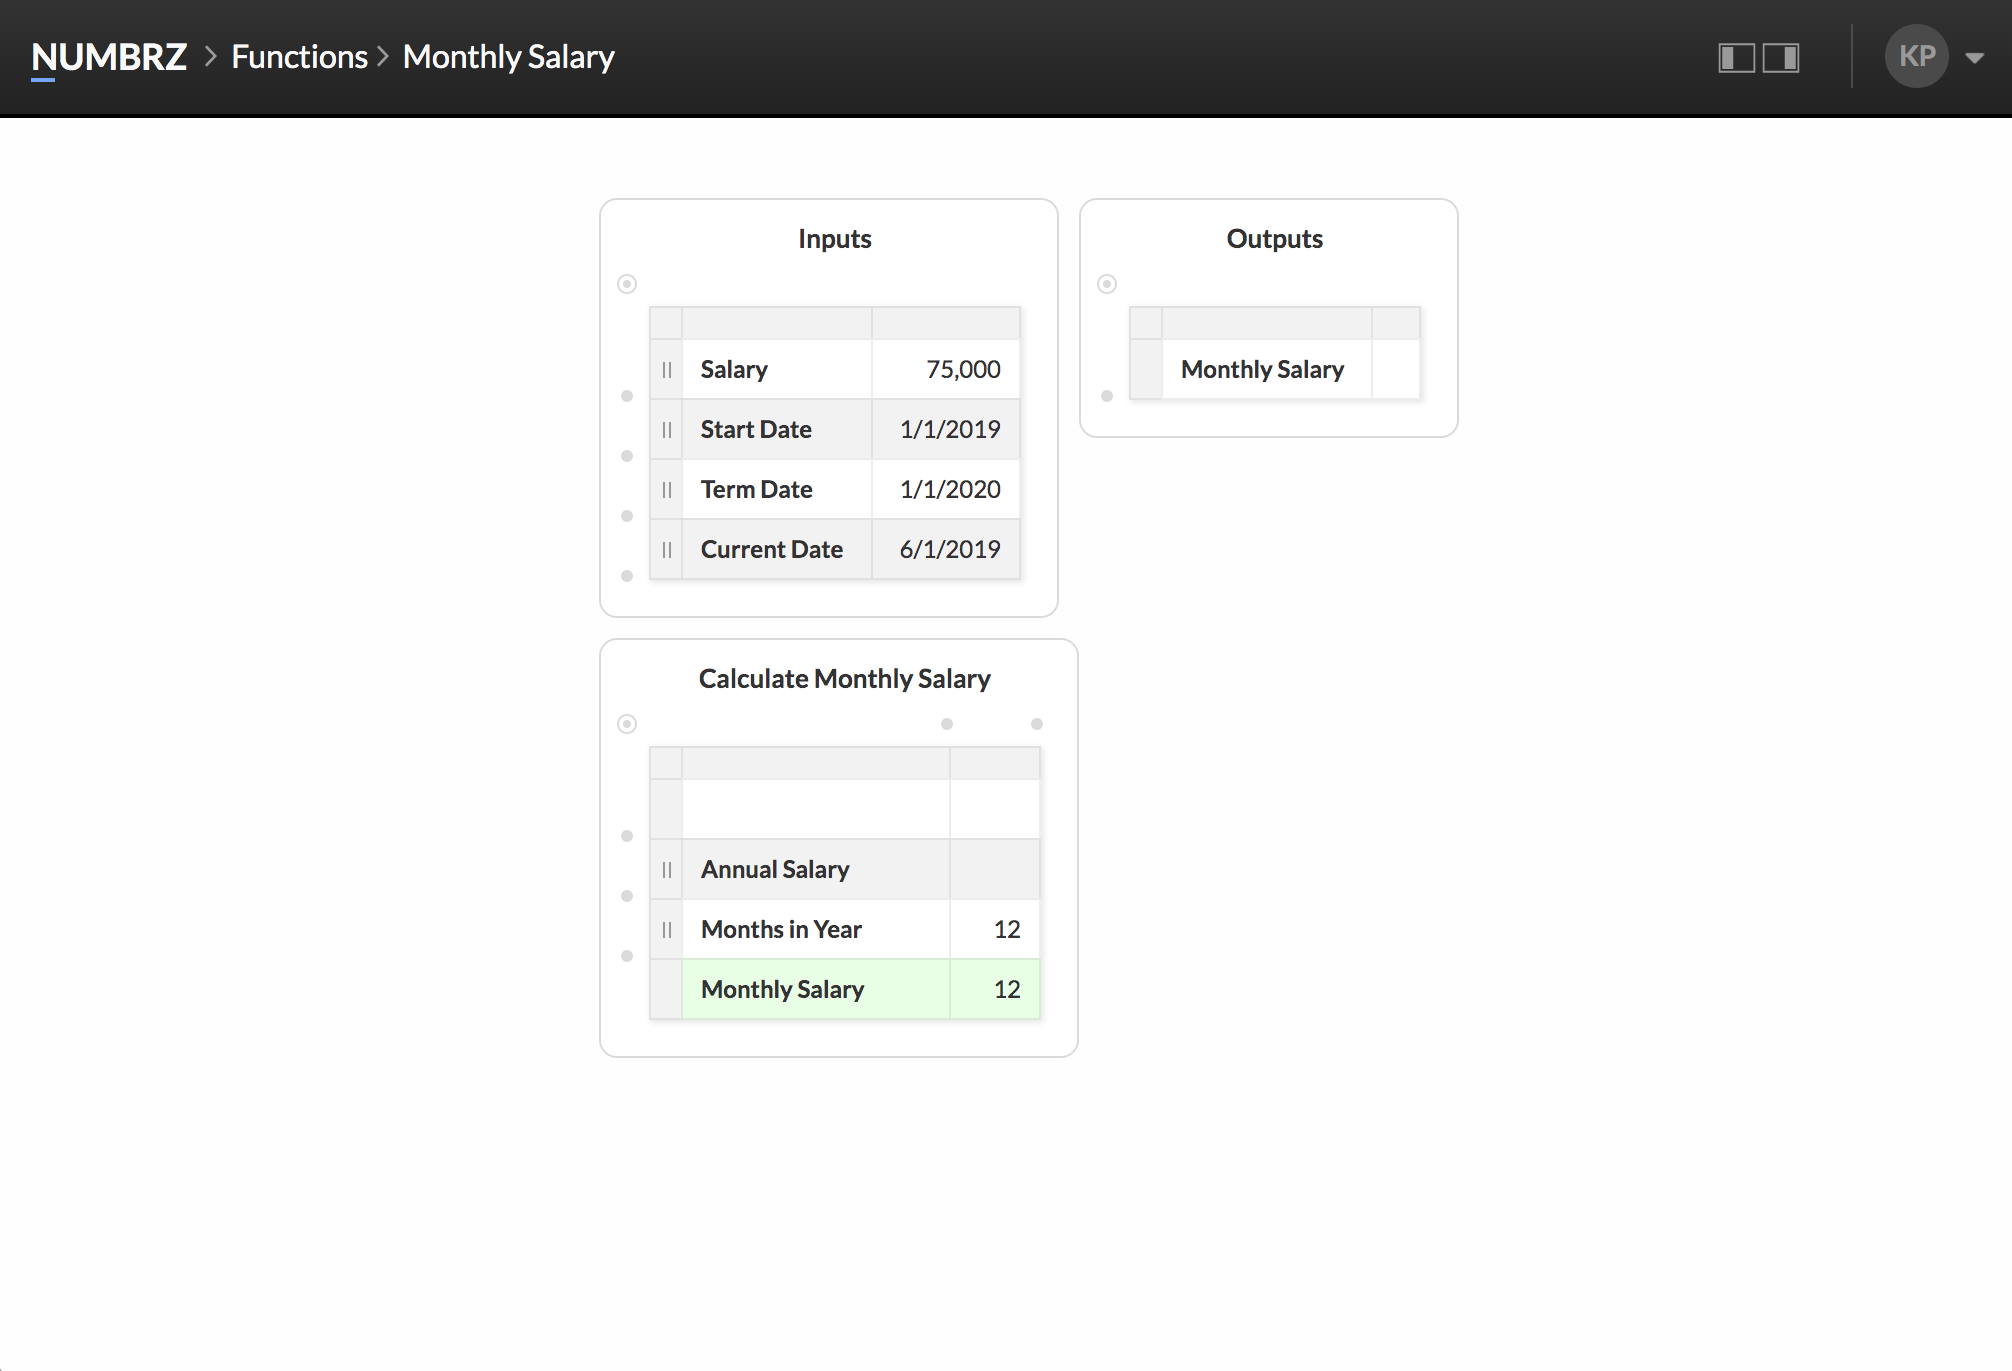
Next, follow the same process to add an Output widget and give it a single row labeled 'Monthly Salary.' Output widgets are used to collect the outputs of a function. These outputs will be used in the Headcount workflow we'll build a little bit later.
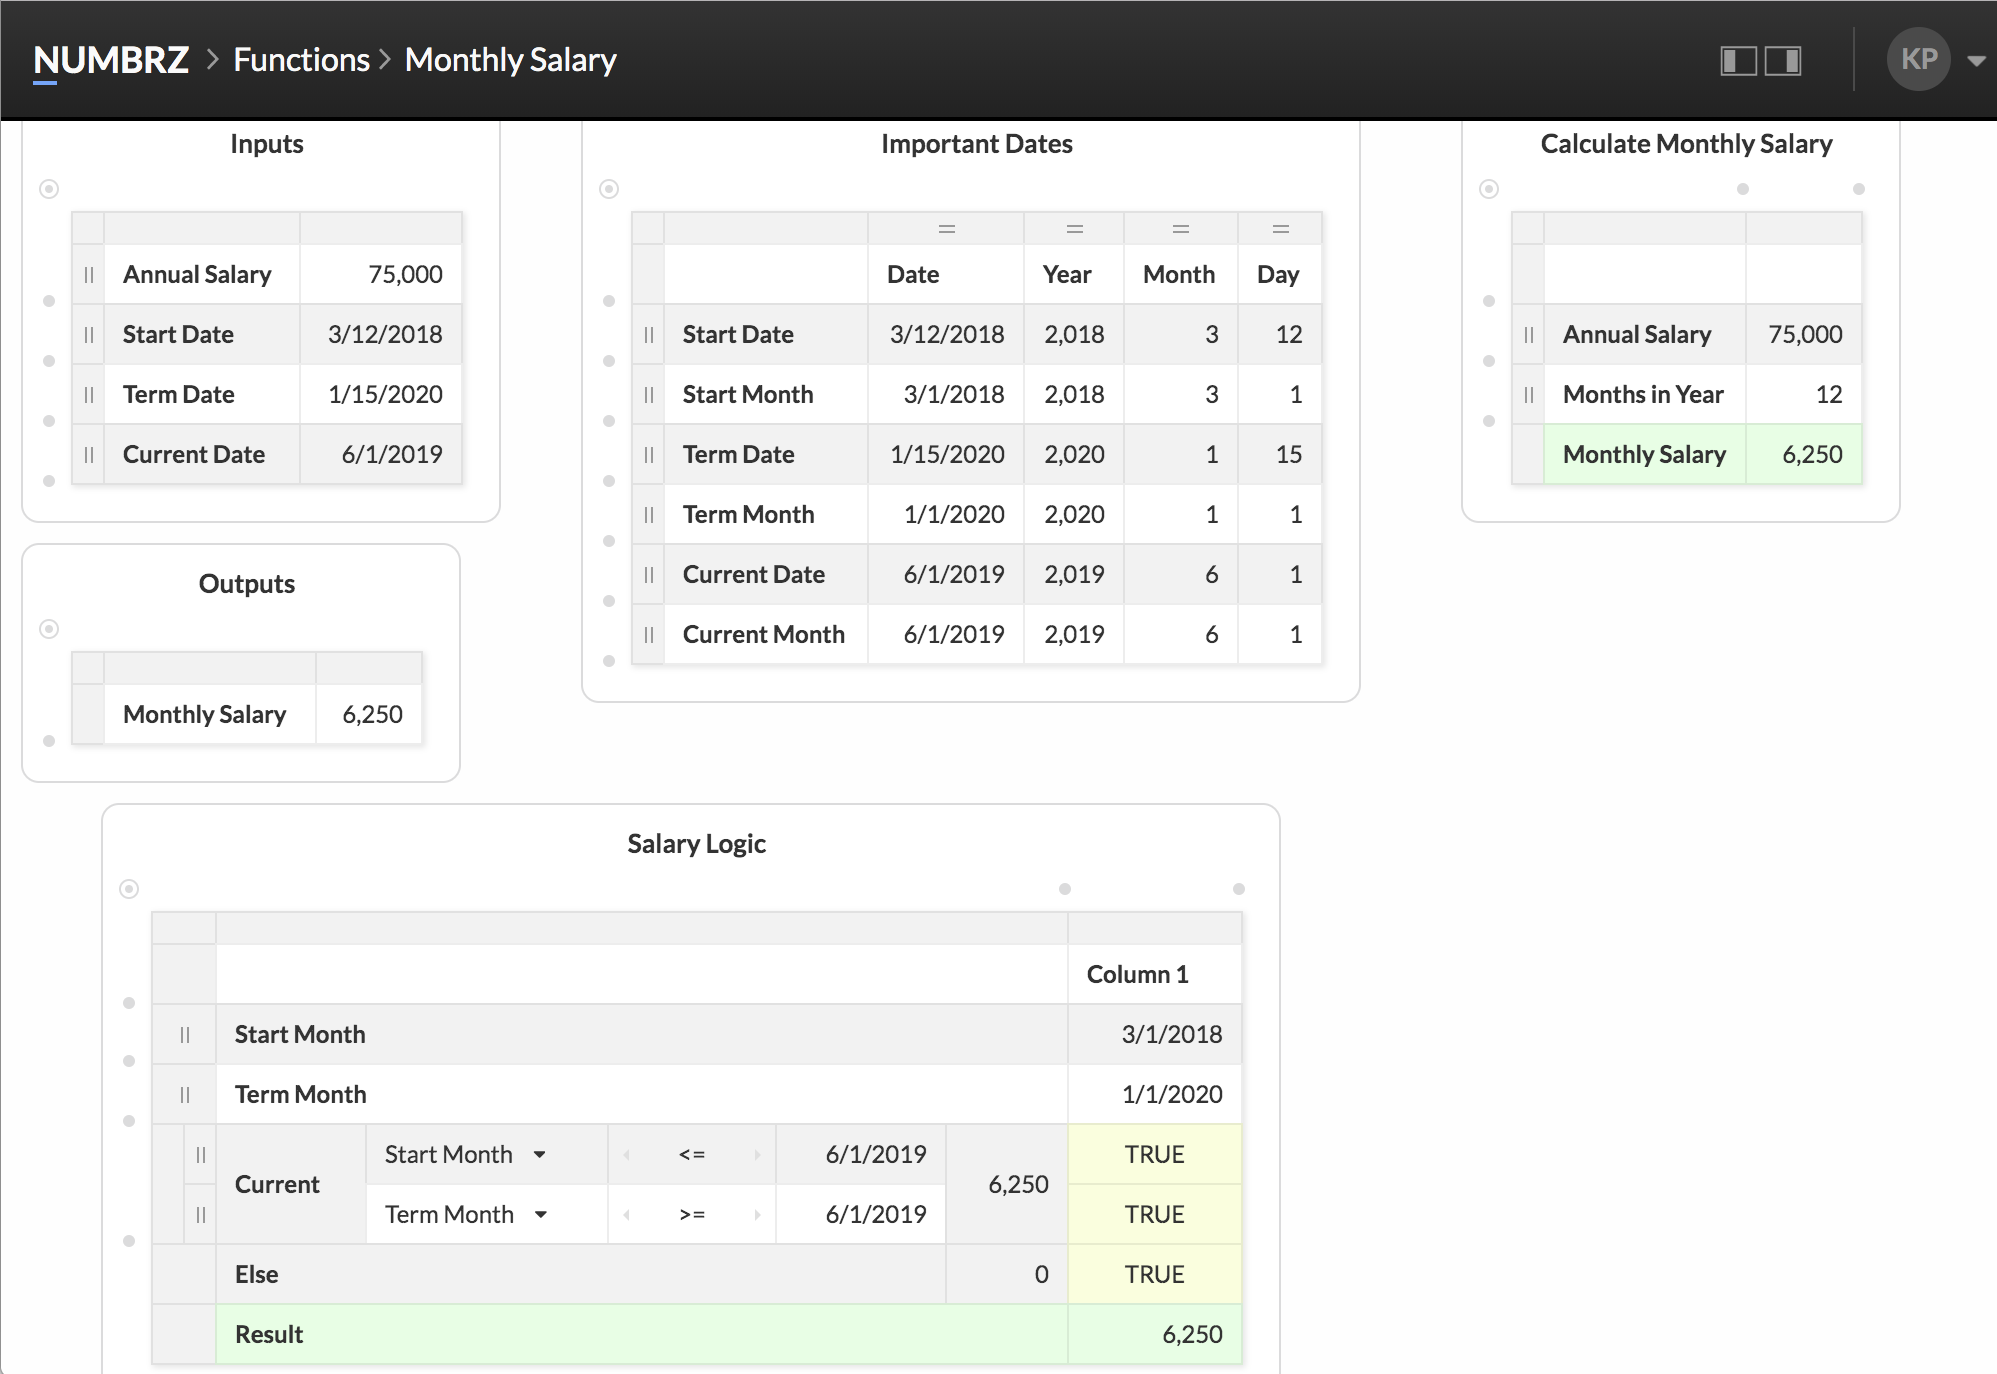
Calculating Monthly Salary
To convert the annual salary we're given as input to a monthly salary, we're going to use a Division widget. As the name suggests, division widgets are used to compute quotients. To add one, double-click the canvas, select 'Division' from the list of widgets on the Add Widget dialog and click 'Add.' You can also quickly select and add a widget by double-clicking it.
To compute the monthly salary, we simply need to divide the annual salary by 12. Set up the widget as follows:
Next, we have to reference the annual salary input in our division widget. To do this, we create a Link. A link is an association between cells which causes changes to the source cell to be propagated to the target. To create a link, drag the source cell onto the target cell:
We're now calculating monthly salary. To use this as the output for the function, create a link from the result cell in our division widget to the output widget we created earlier:
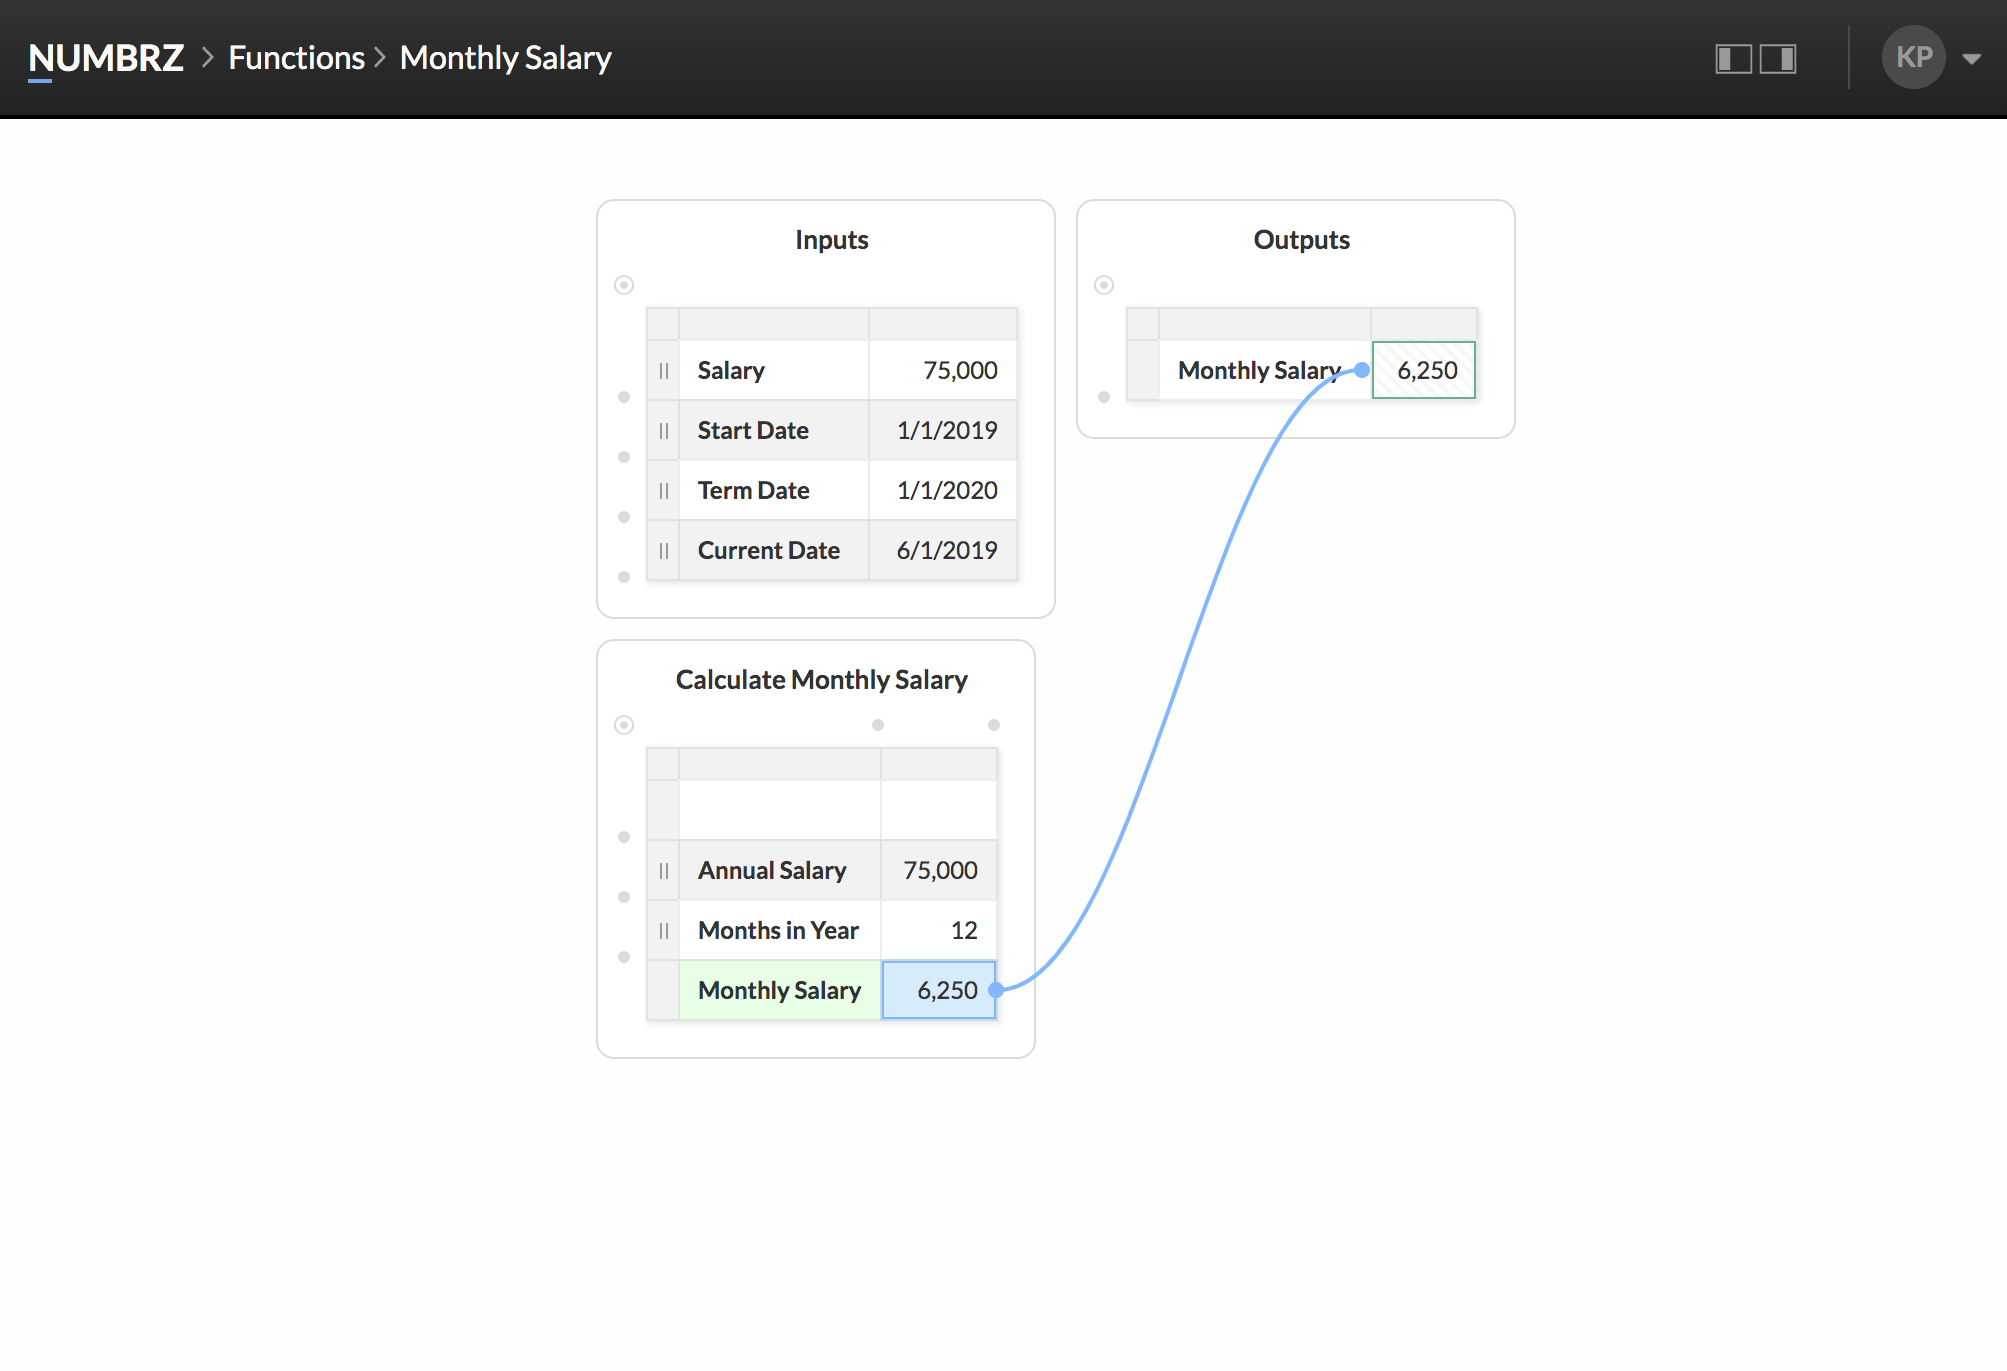
We now have a working function! It's currently very simple - all it does is compute the monthly salary from an annual salary, but it can be used in any workflow where such a calculation might be useful.
Calculating the Current Month's Salary
To make our function a little more useful, we need to take into consideration the employee's start and termination dates. We will update our logic to only pay the employee for months that they are actually employed. To keep this tutorial simple, we won't pro-rate this calculation for partial months, but this can be accomplished using the same techniques described here.
To get started, we need to convert the start and termination dates to months. To do this we're going to use a Date widget. The date widget is very useful: it can be used to split a date into a day, month and year, or compose a date from a day, month, and year. We're going to use both of these capabilities.
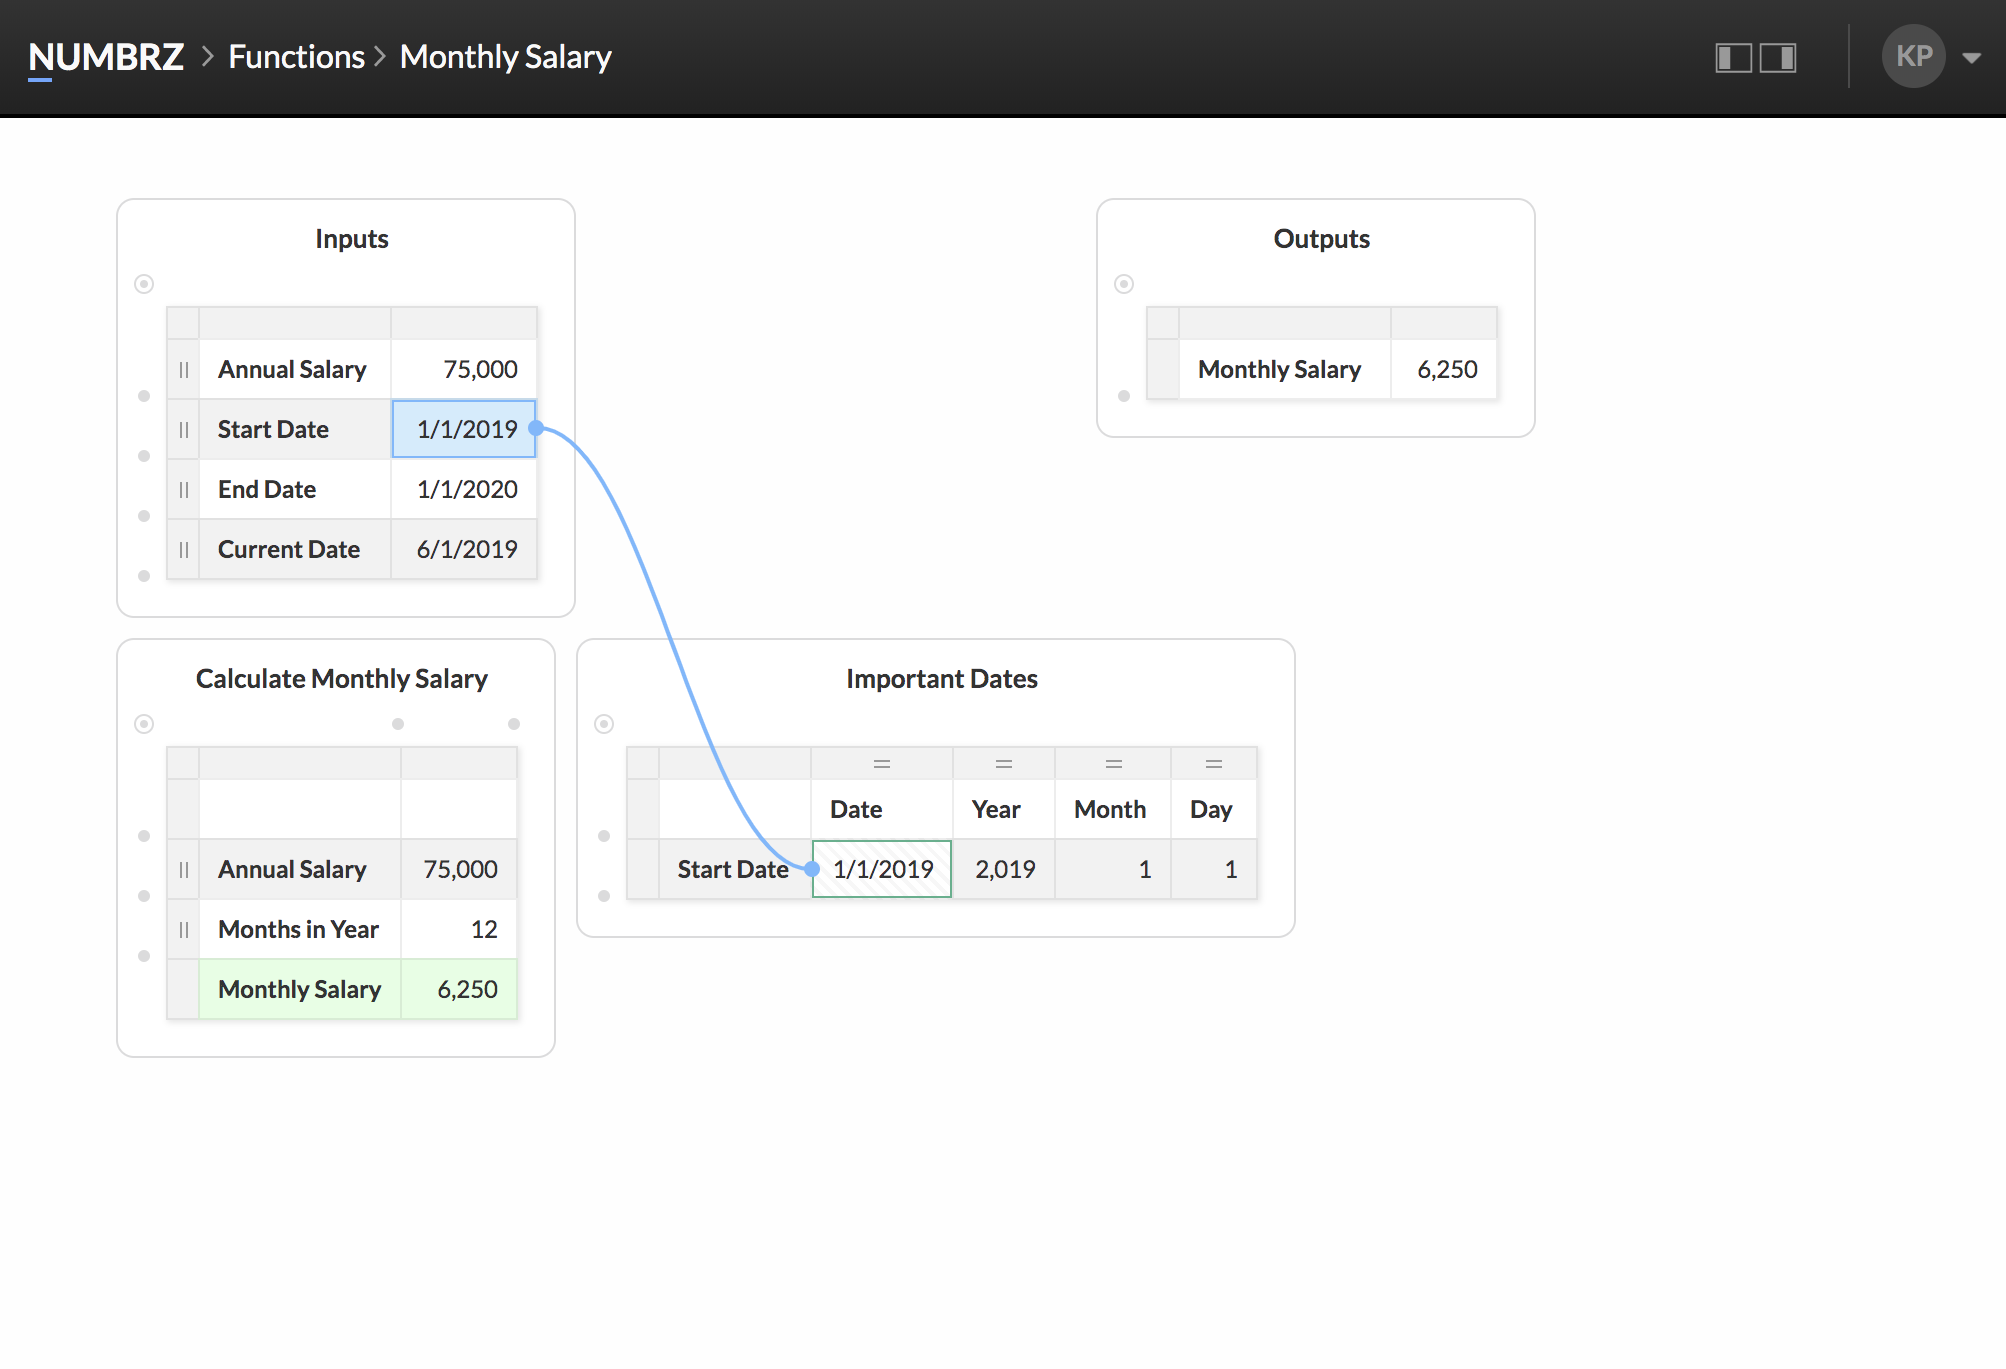
Start by adding a date widget, and linking the start date to the 'Date' cell:
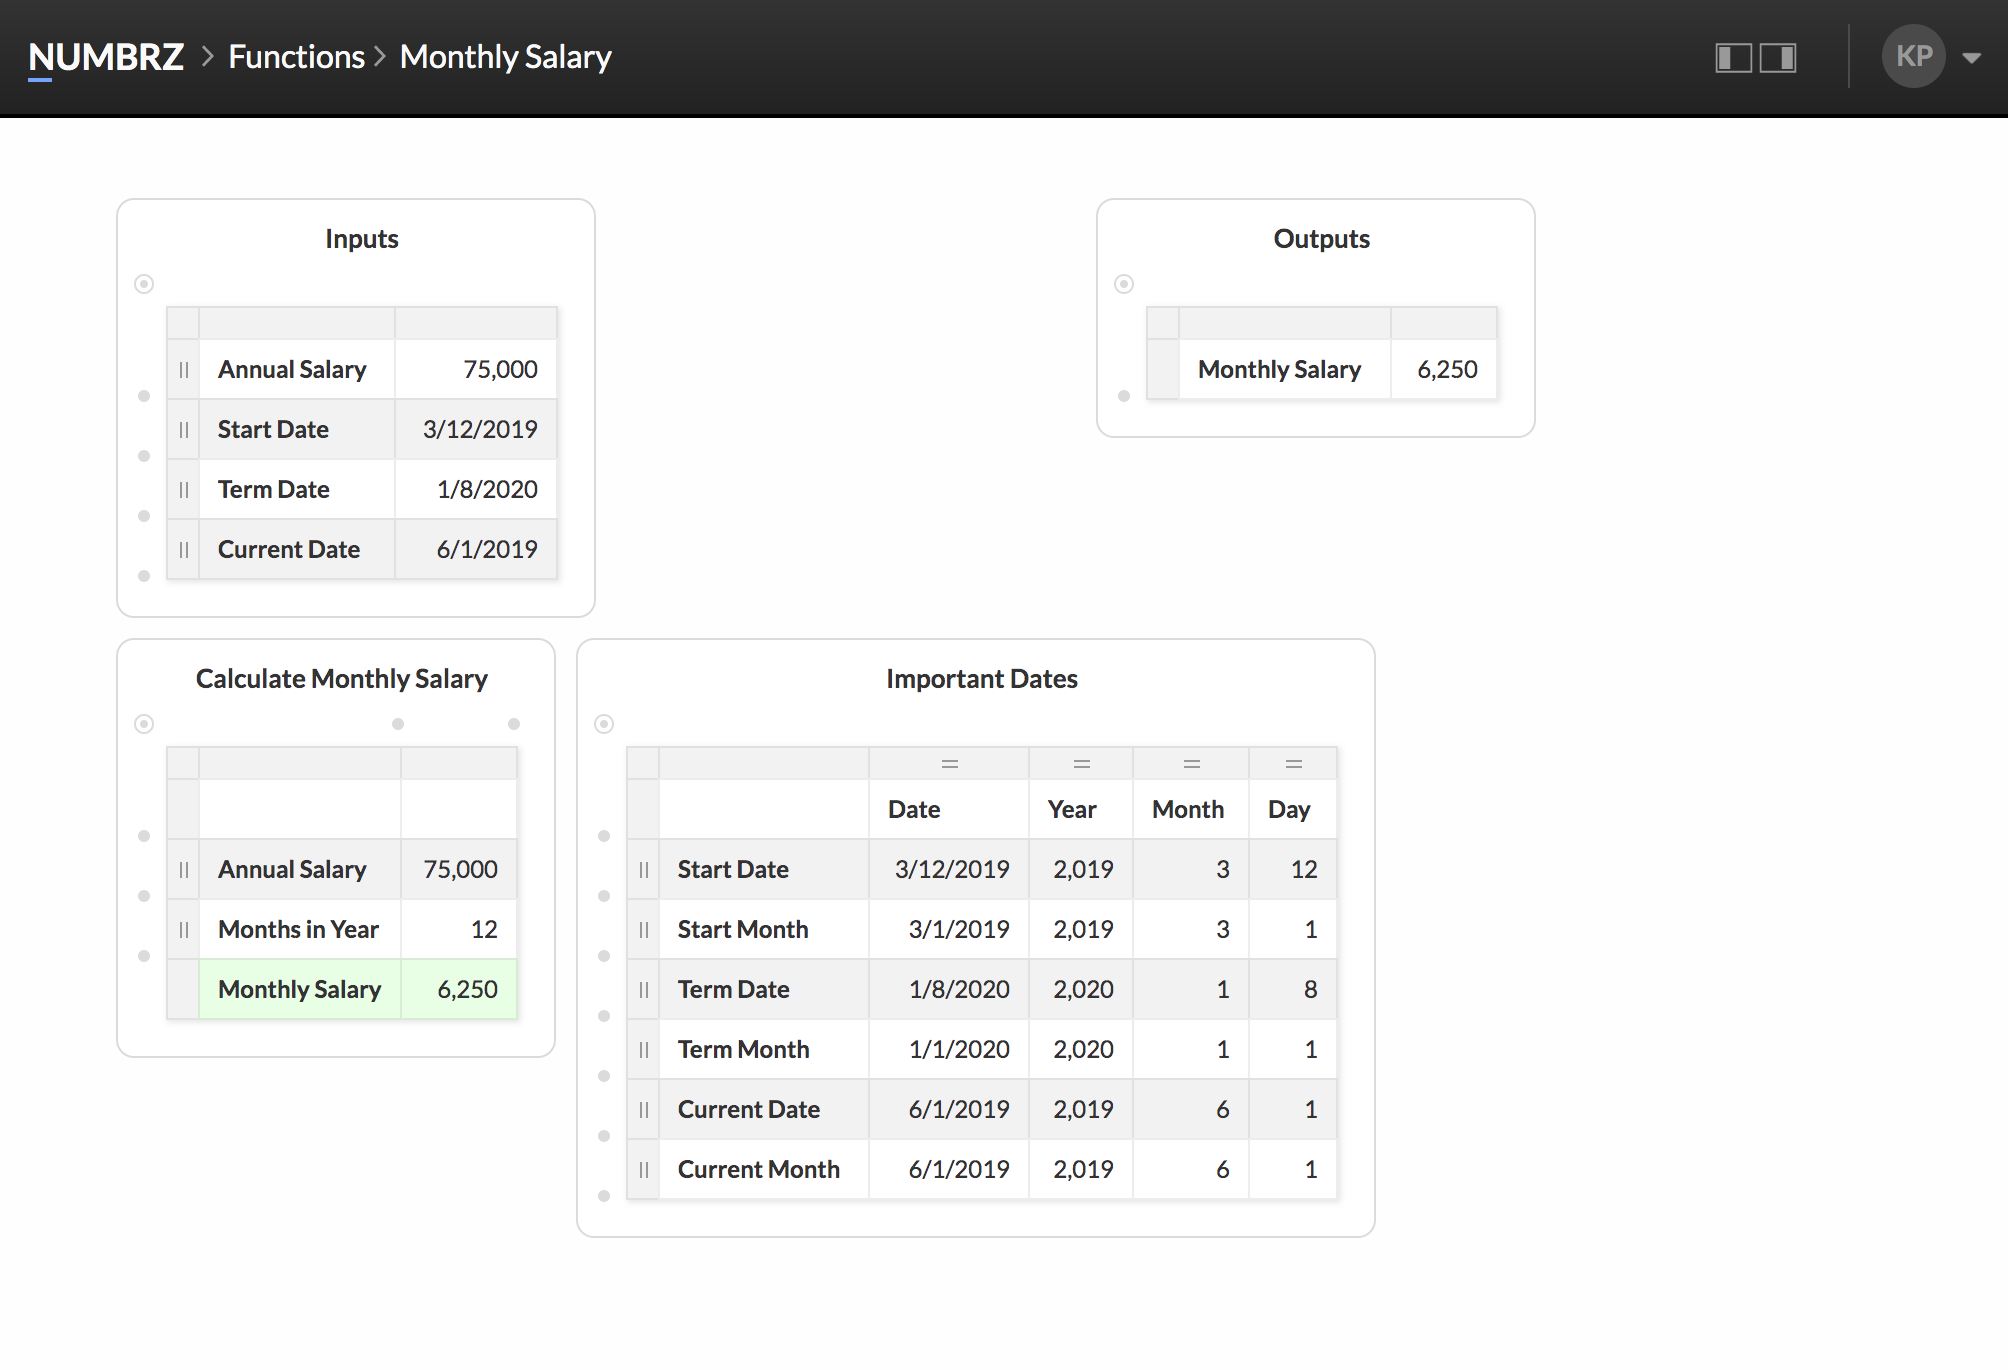
Next, calculate the start month by linking the year and month of the start date, and hard-coding the day to '1':
Repeat these steps to calculate the termination month and current month:
Interlude: Numbrz Functions are Templates
When a function is used in a workflow (we'll create a headcount workflow next), the Numbrz engine replaces the inputs of the function with values pulled from the data sources you specify. In this way, a Numbrz function acts like a template, keeping the logic of your calculations completely separate from your data. This means the values you place in the inputs of your function can be anything. This makes it easy to experiment with your function and verify that it's working as expected. You can see this in action by playing with different values in the inputs.
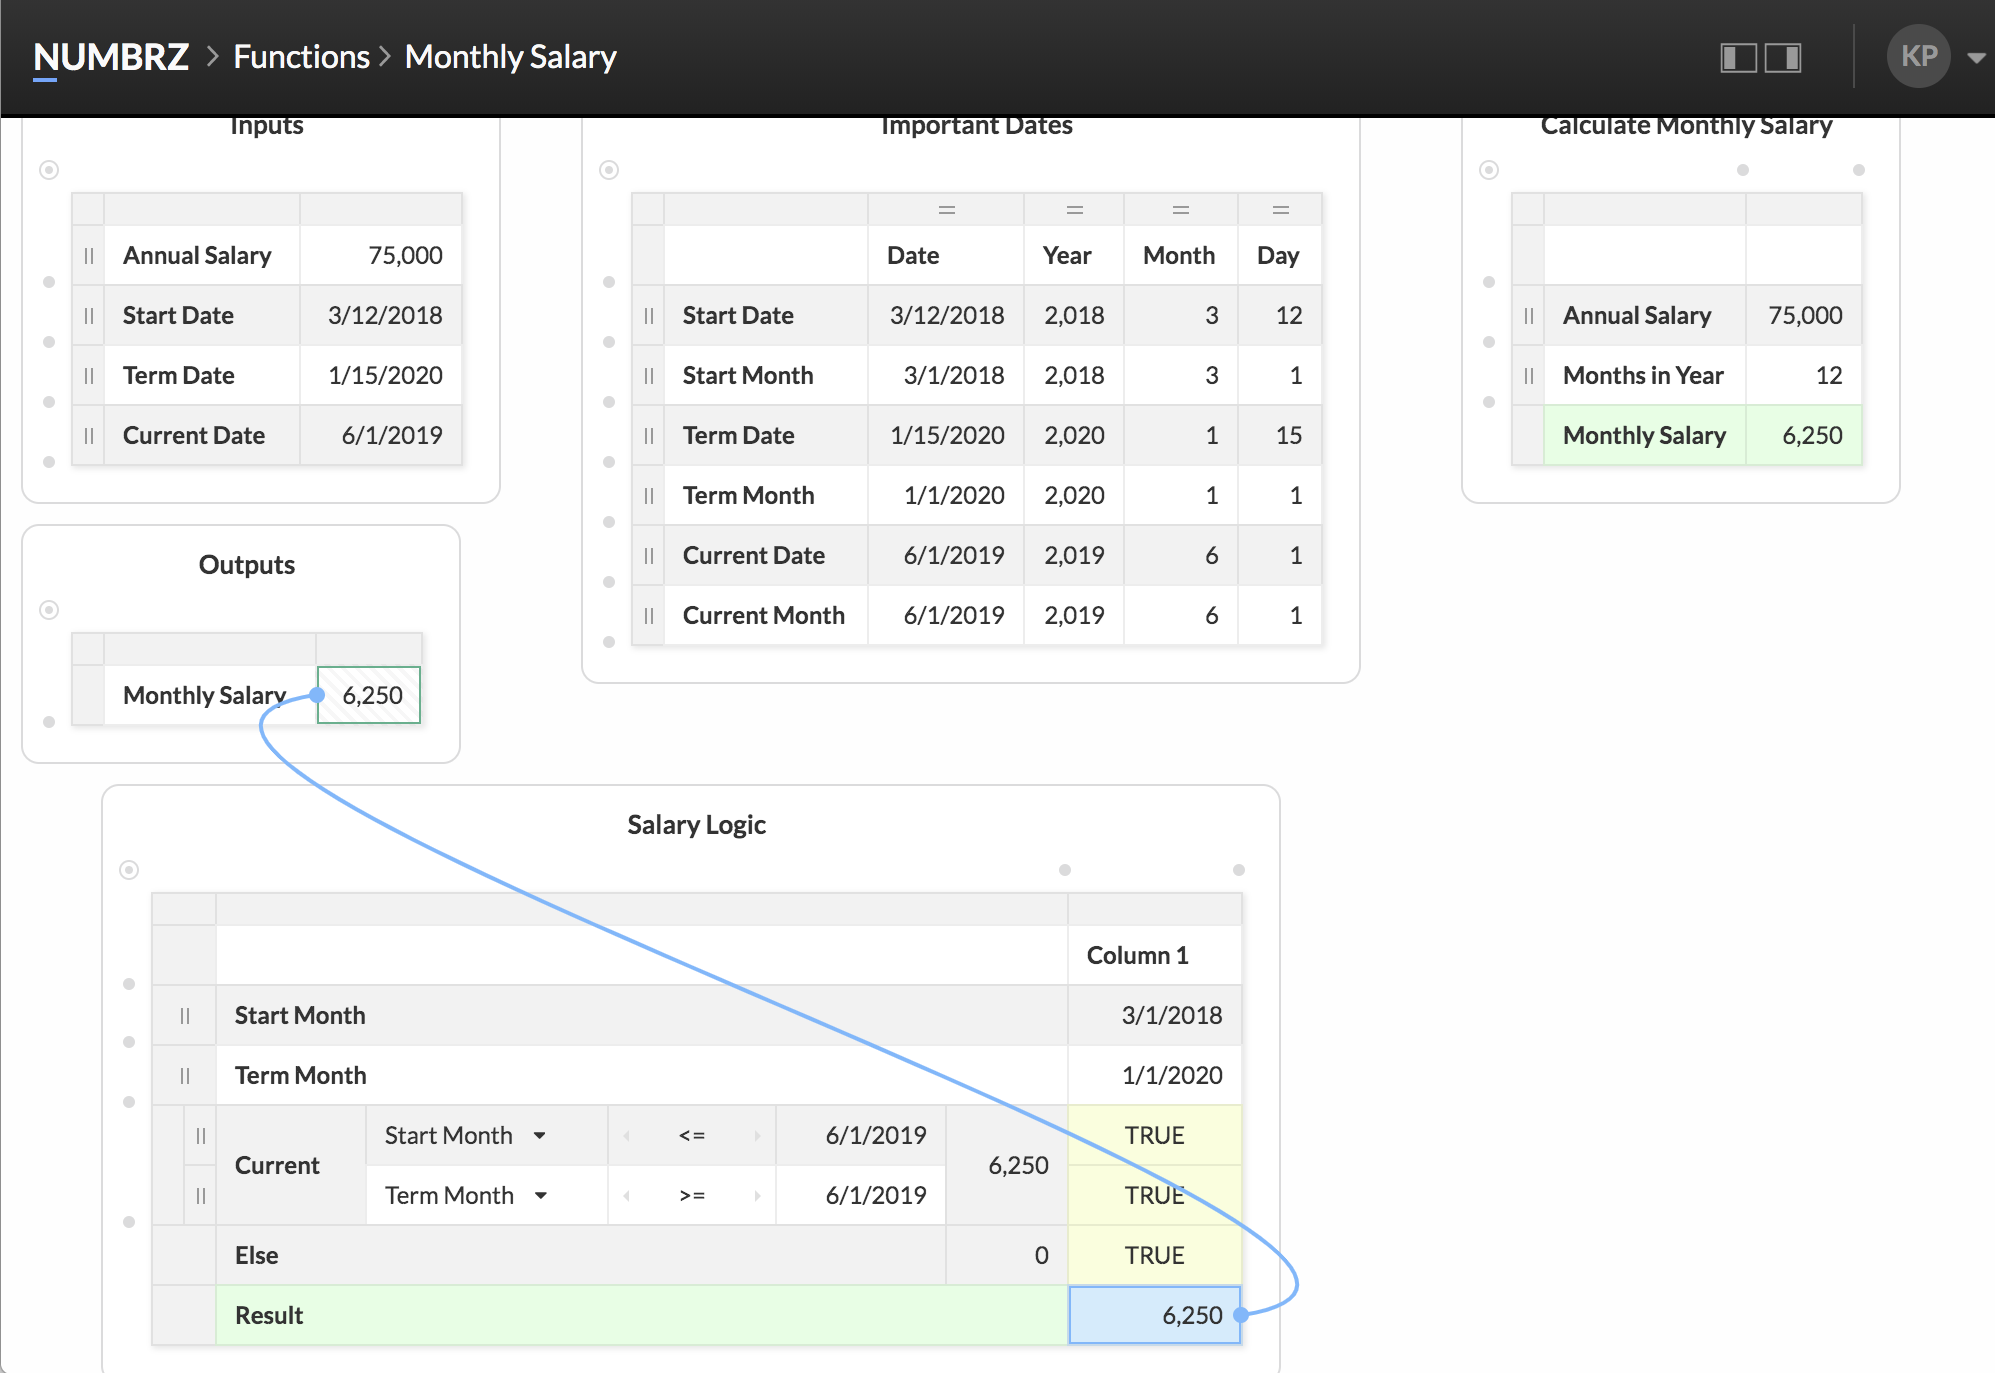
Finishing the Salary Logic
To complete our salary function, we'll need one more type of widget: the Switch widget. Switch widgets are used to produce values based on a set of rules. We're going to use this widget to figure out if the employee was employed for the current month. Start by adding a new Switch widget:
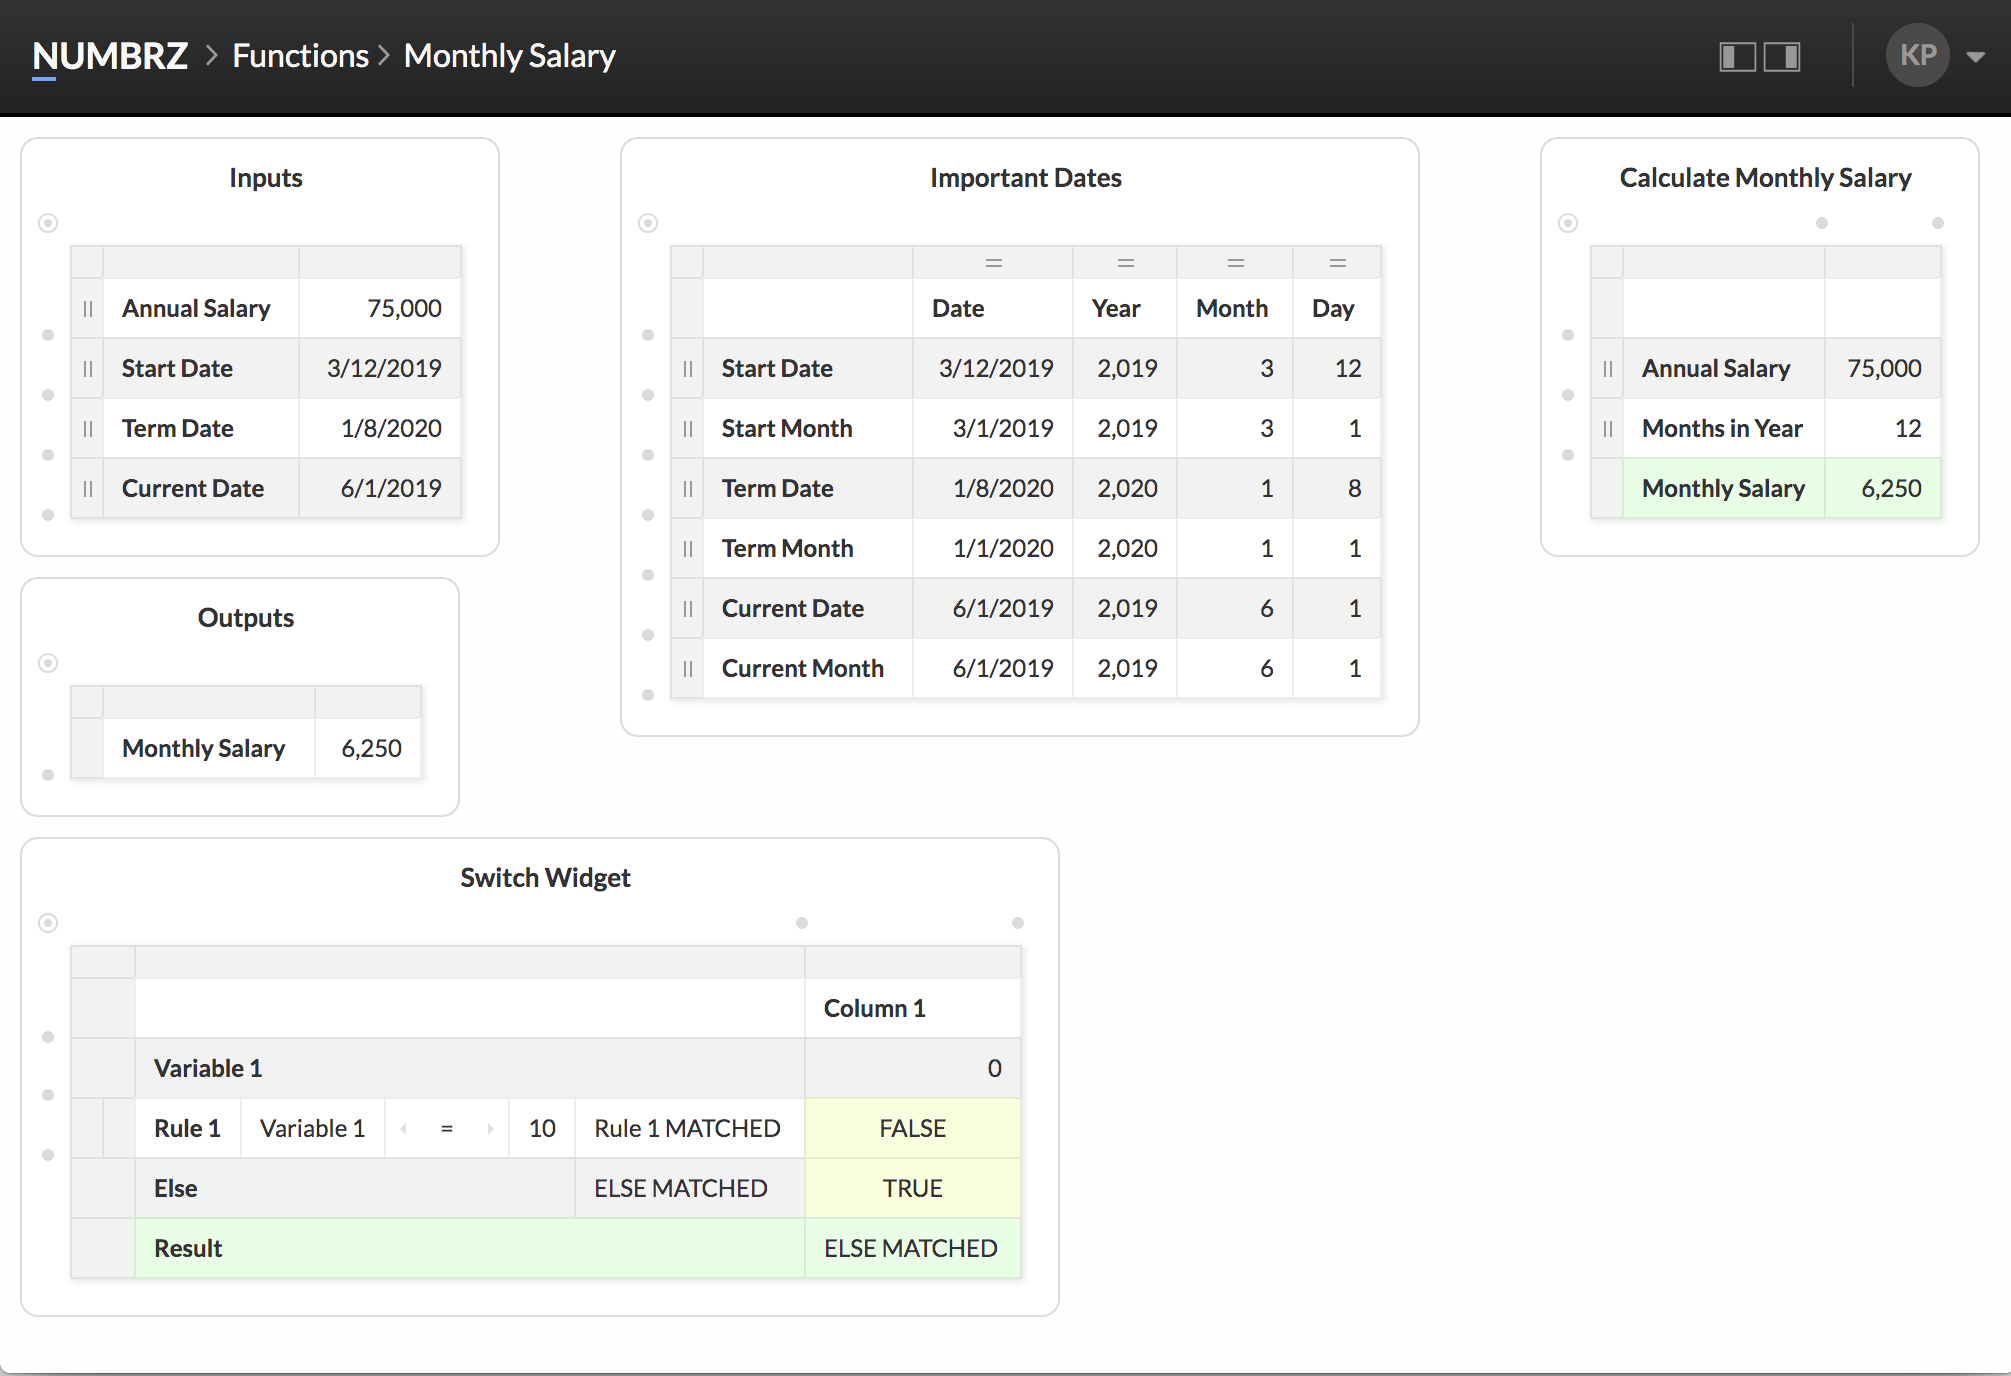
The switch widget is a little more complicate than the other widgets we've seen so far. It is made of up three sections:
So, let's set up our salary logic. We're going to need the start month and term month as variables:
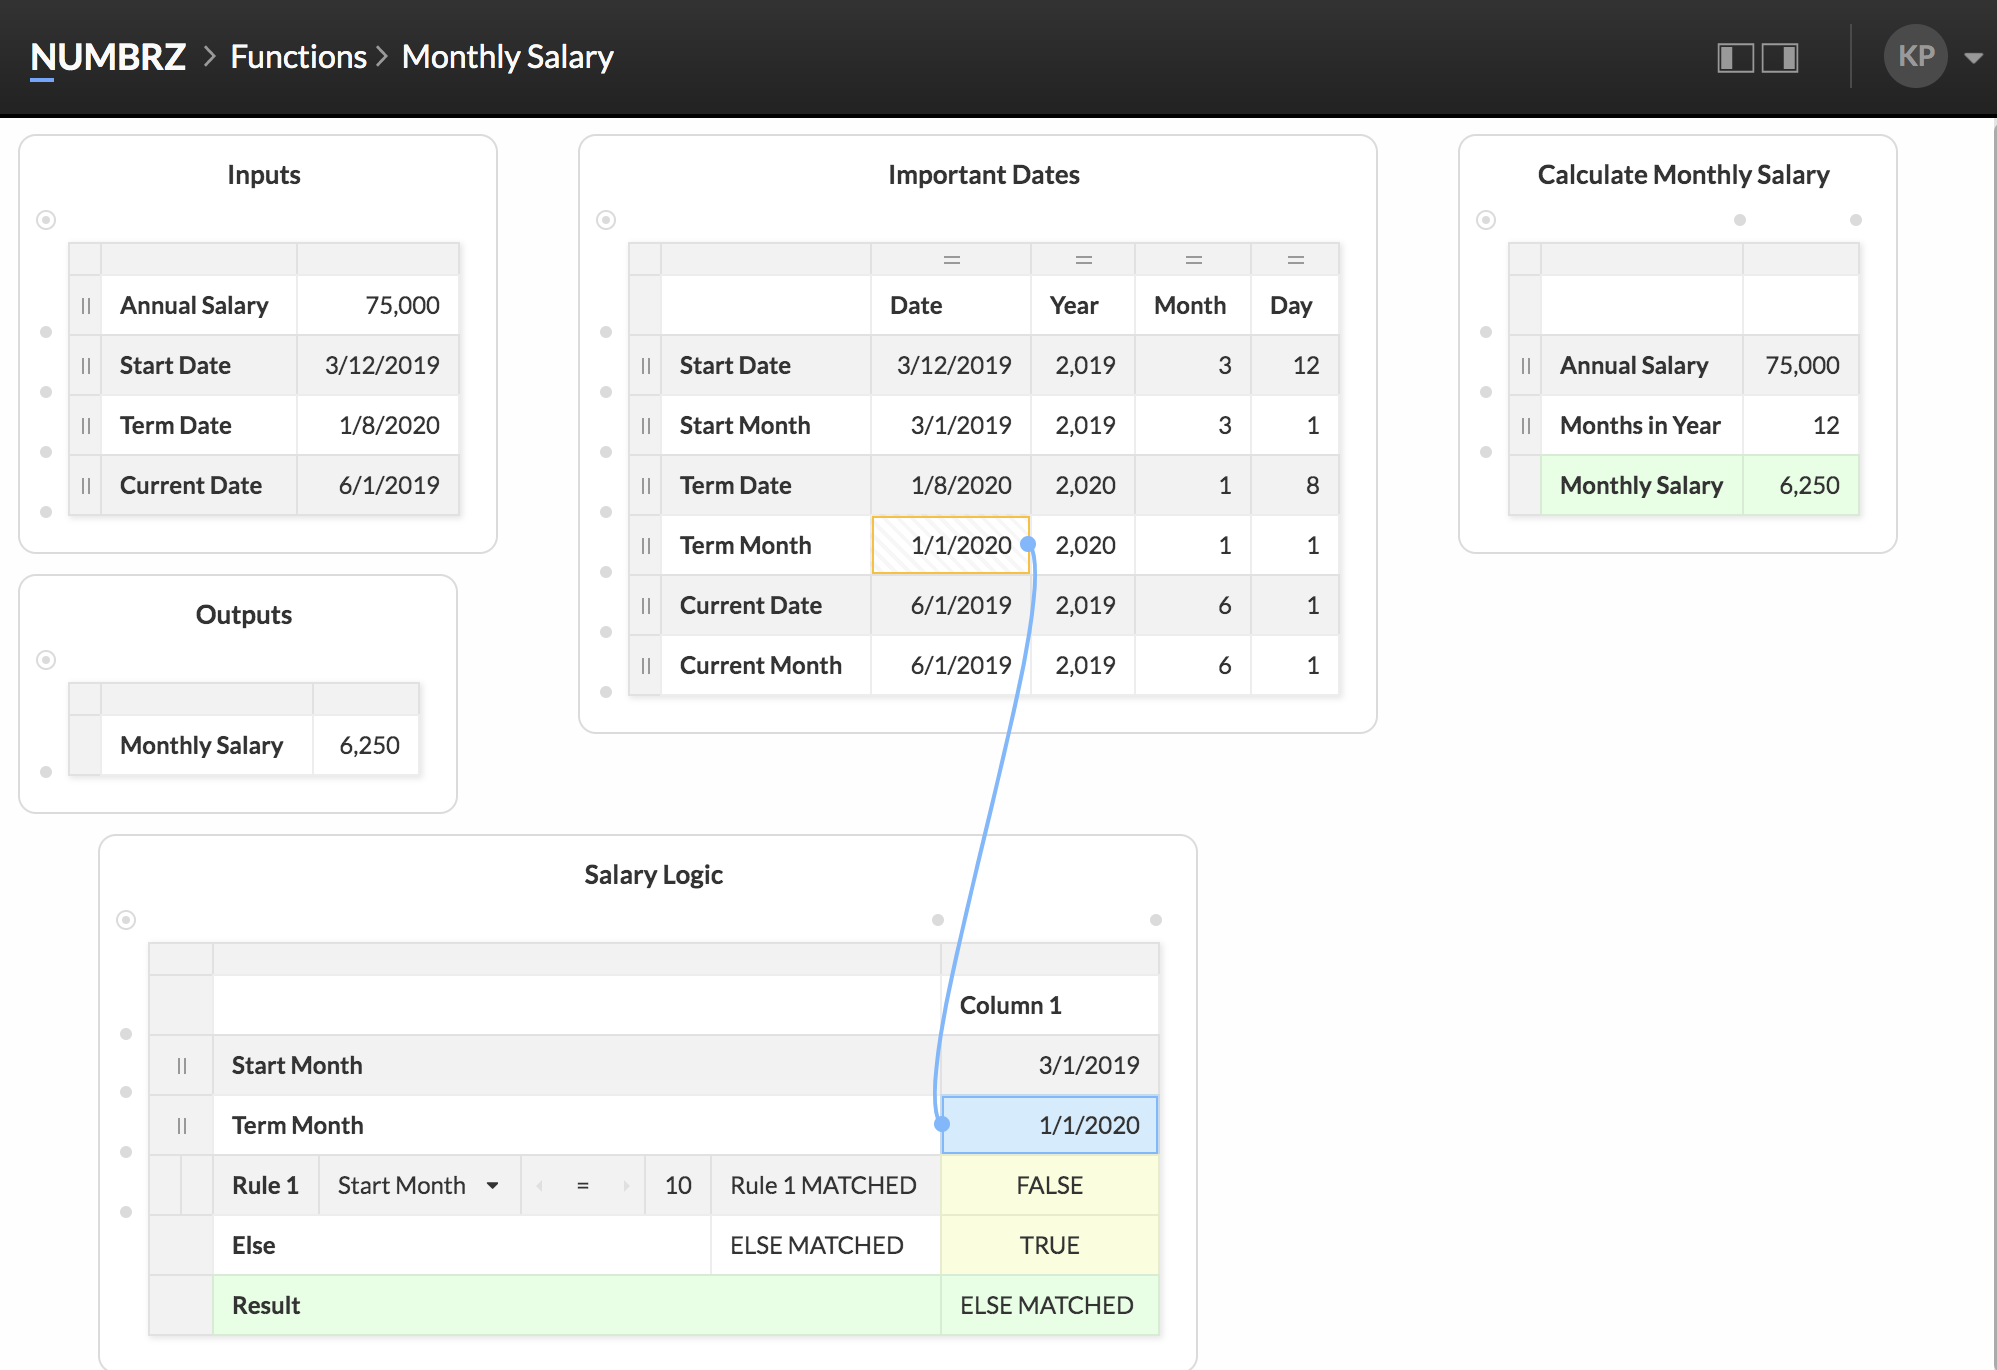
Next, update the first rule so it checks if the employee started no later than the current month, and terminated no earlier than the current month:
Next, we need this rule to output the monthly salary when it matches:
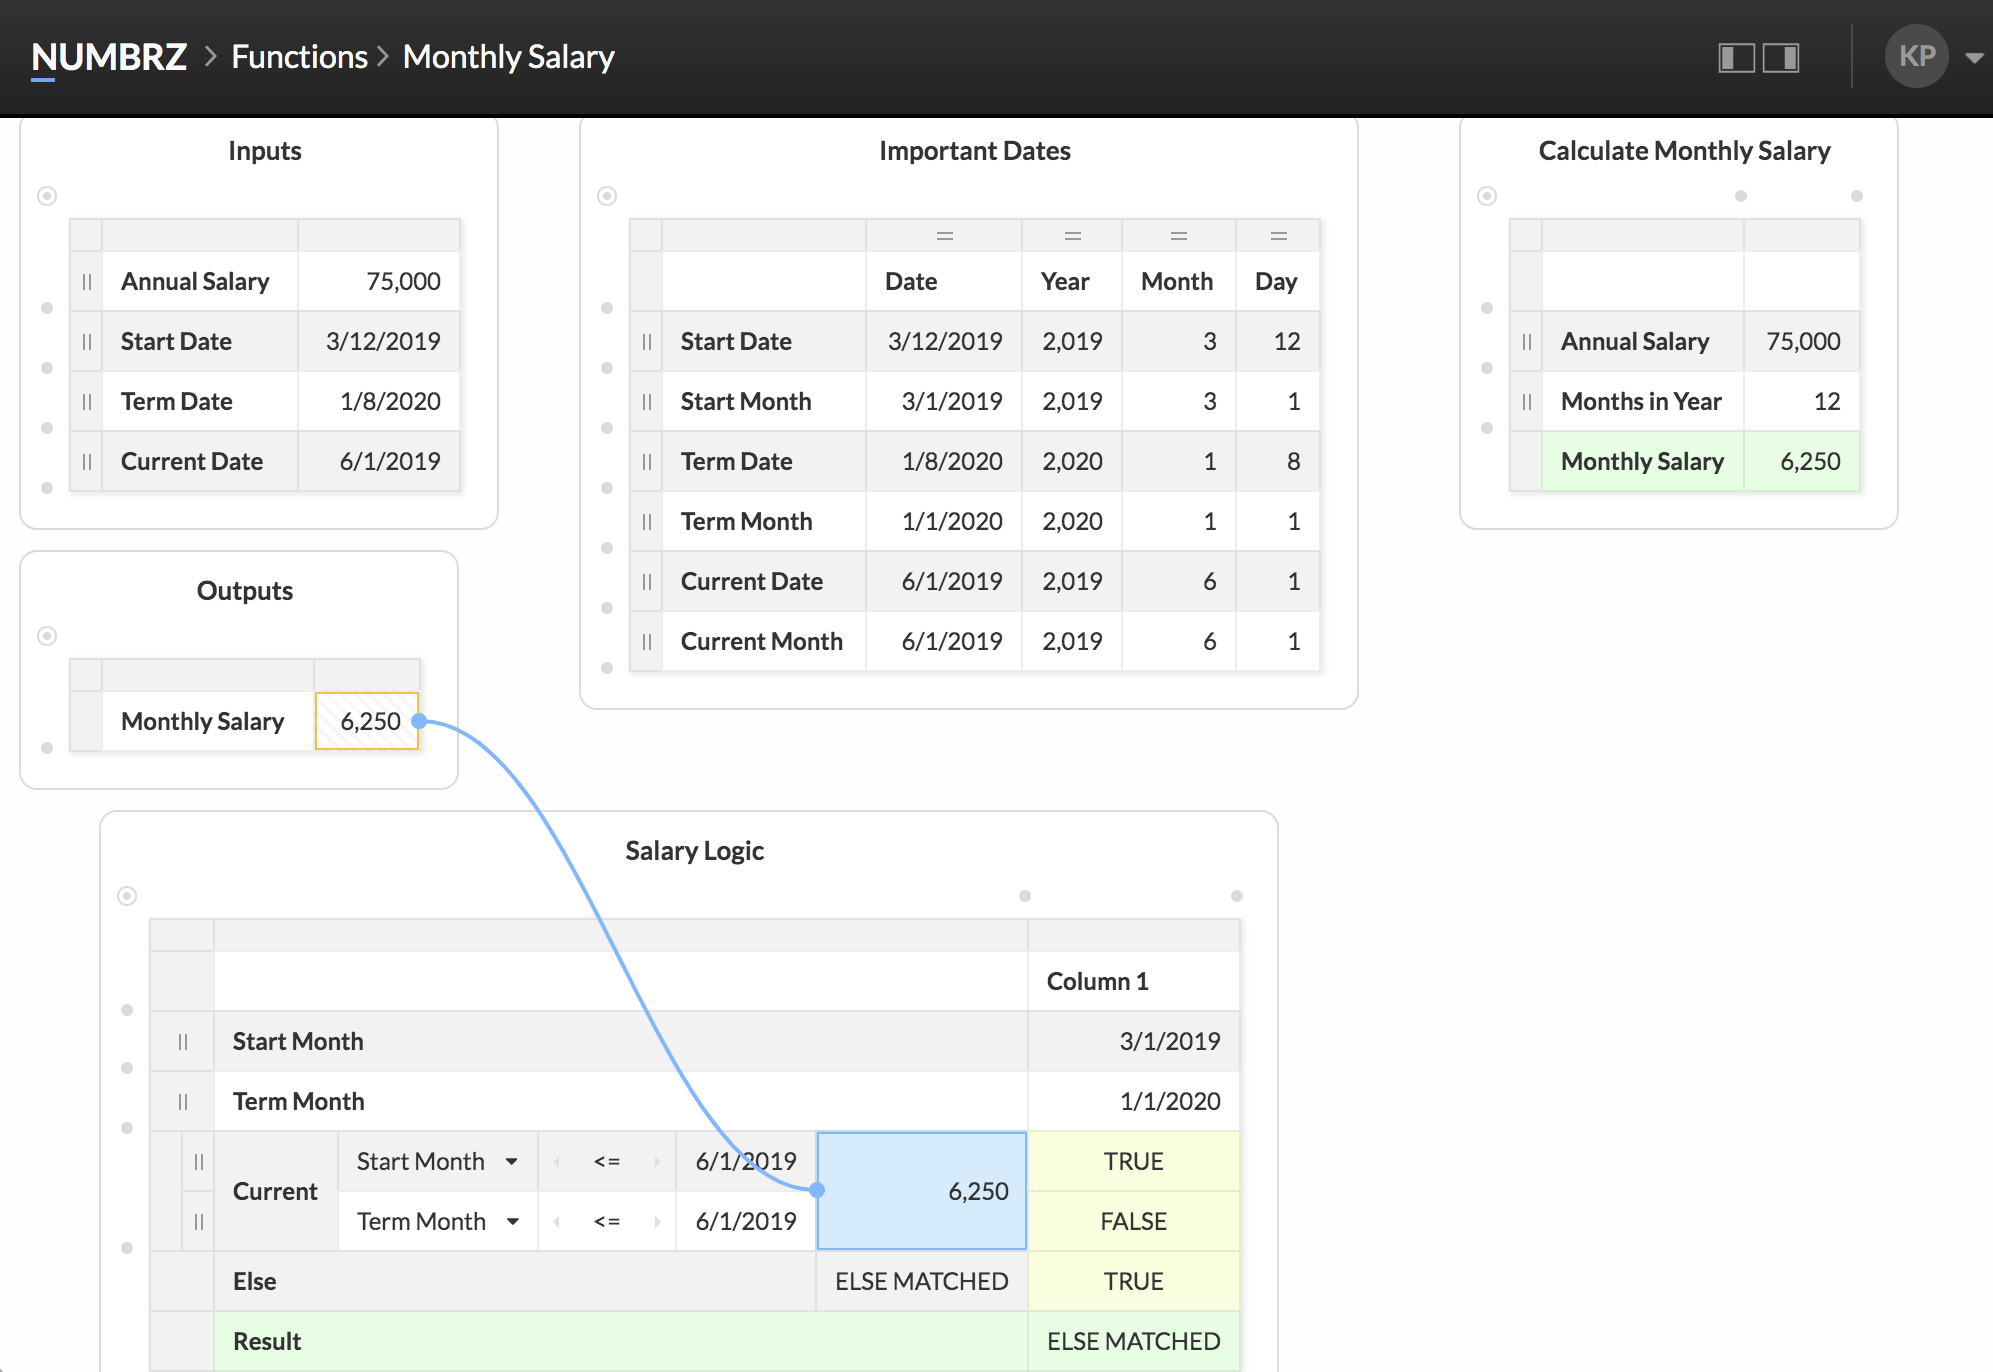
This takes care of outputting the previously calculated monthly salary when the employees is employed in the current month. To handle the case where they are not, we take advantage of the Else rule, which is only used when no other rule matches. In this case, we want the salary to be zero. To achieve this, set the result value for the 'Else' rule to '0':
We're almost done! We just need to use the result of our Salary Logic widget as the output for our function:
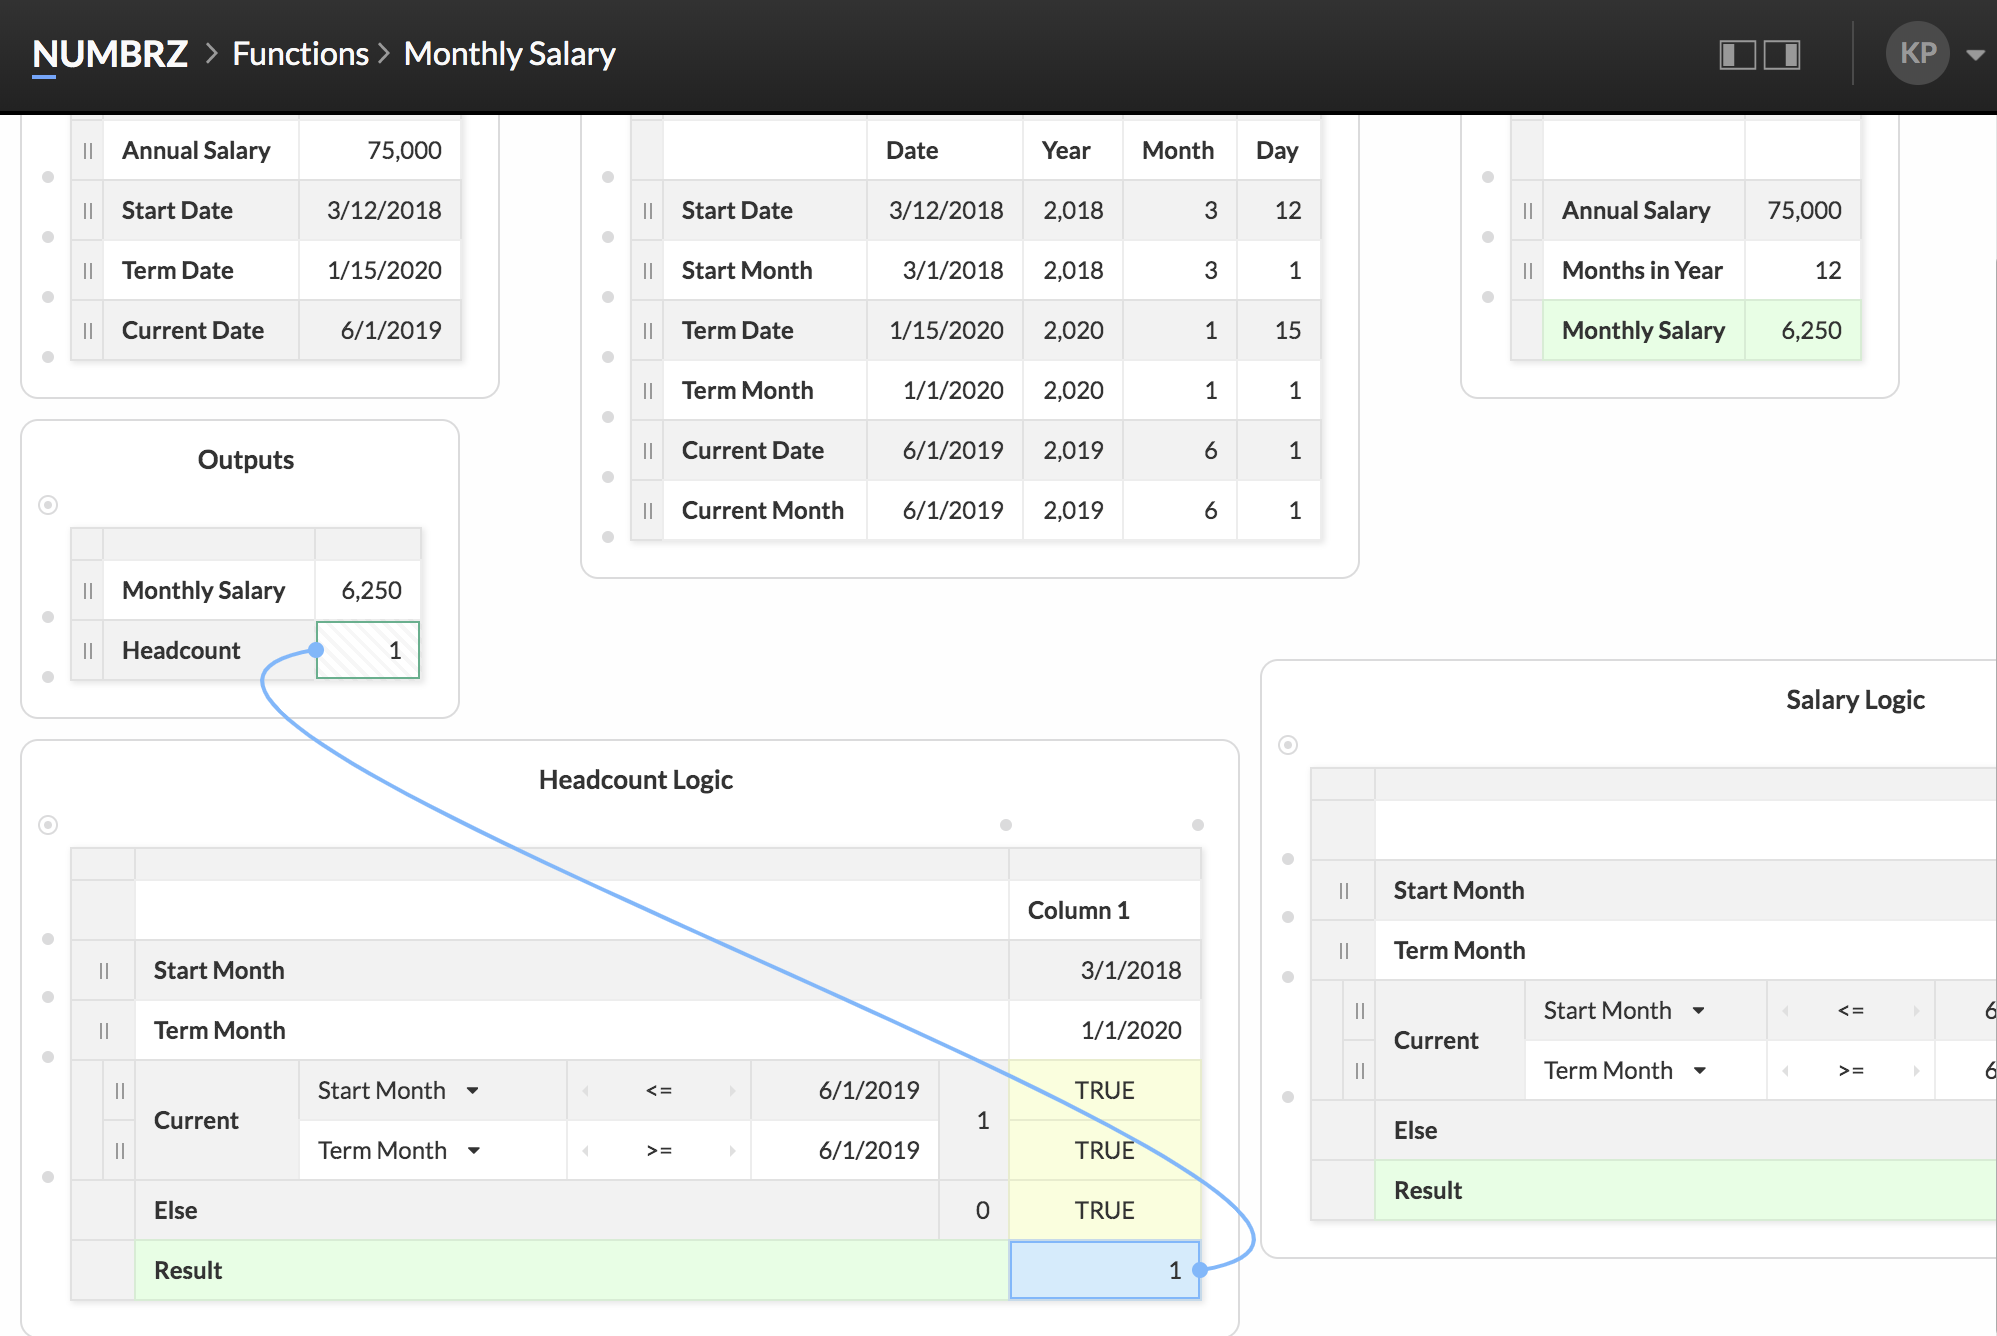
Adding the Headcount Calculation
To complete our function, we need to add the logic to calculate the employee's headcount contribution for the current month. This works very similarly to the salary logic, and just requires a second switch widget:
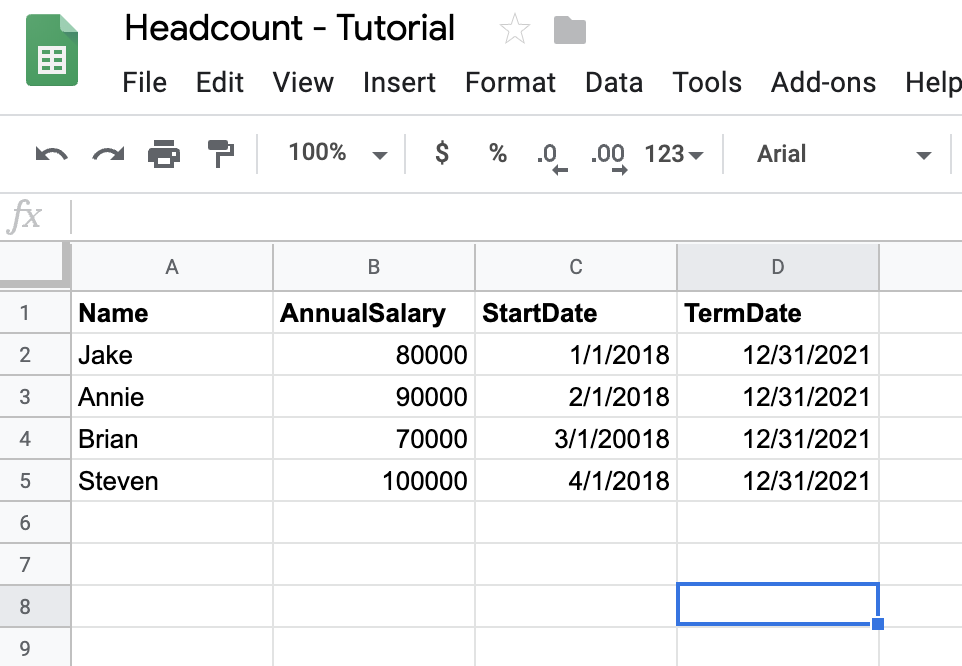
Setting Up Datasets
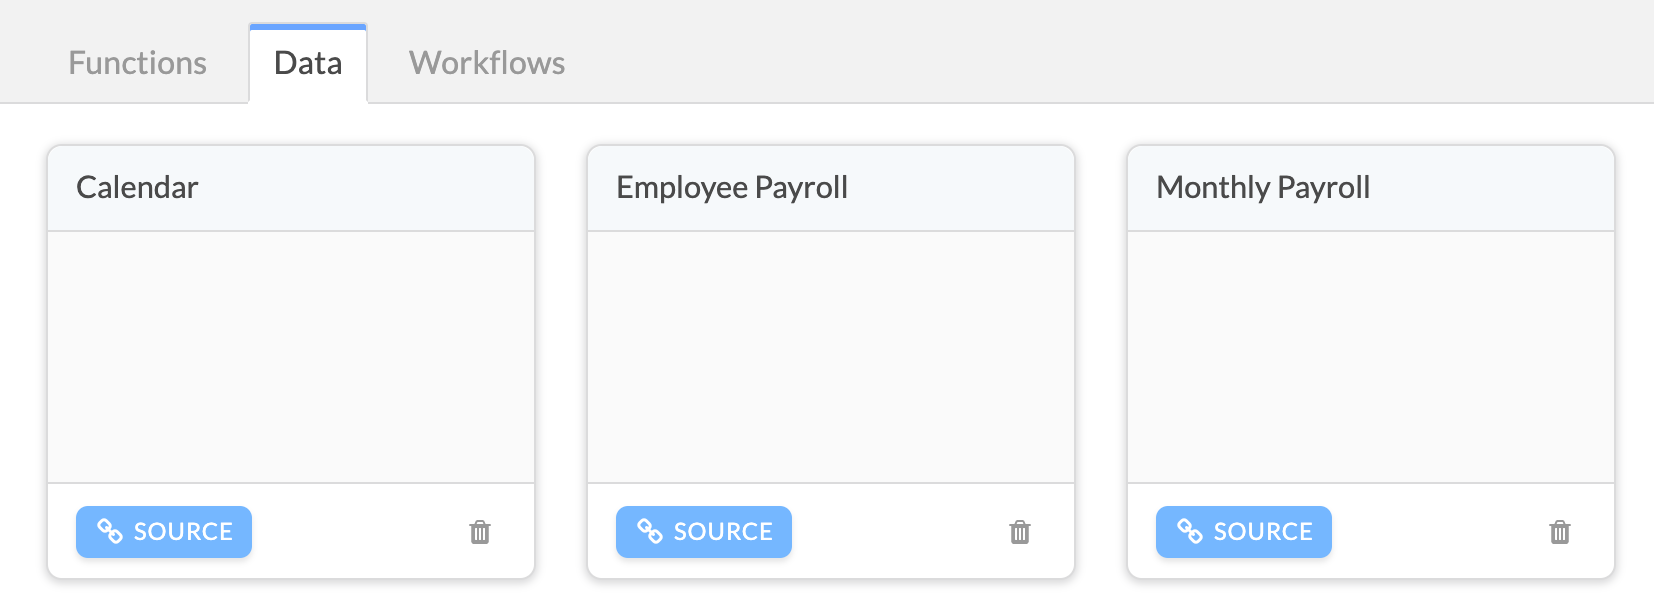
In order for our headcount workflow to work with real data we have to configure three datasets: Input, Calendar, and Output. Create a GSheet with three tabs titled: Employee Payroll, Calendar, and Monthly Payroll. The Employee Payroll tab should match the following structure and content:
The Calendar tab should match the following structure and content:
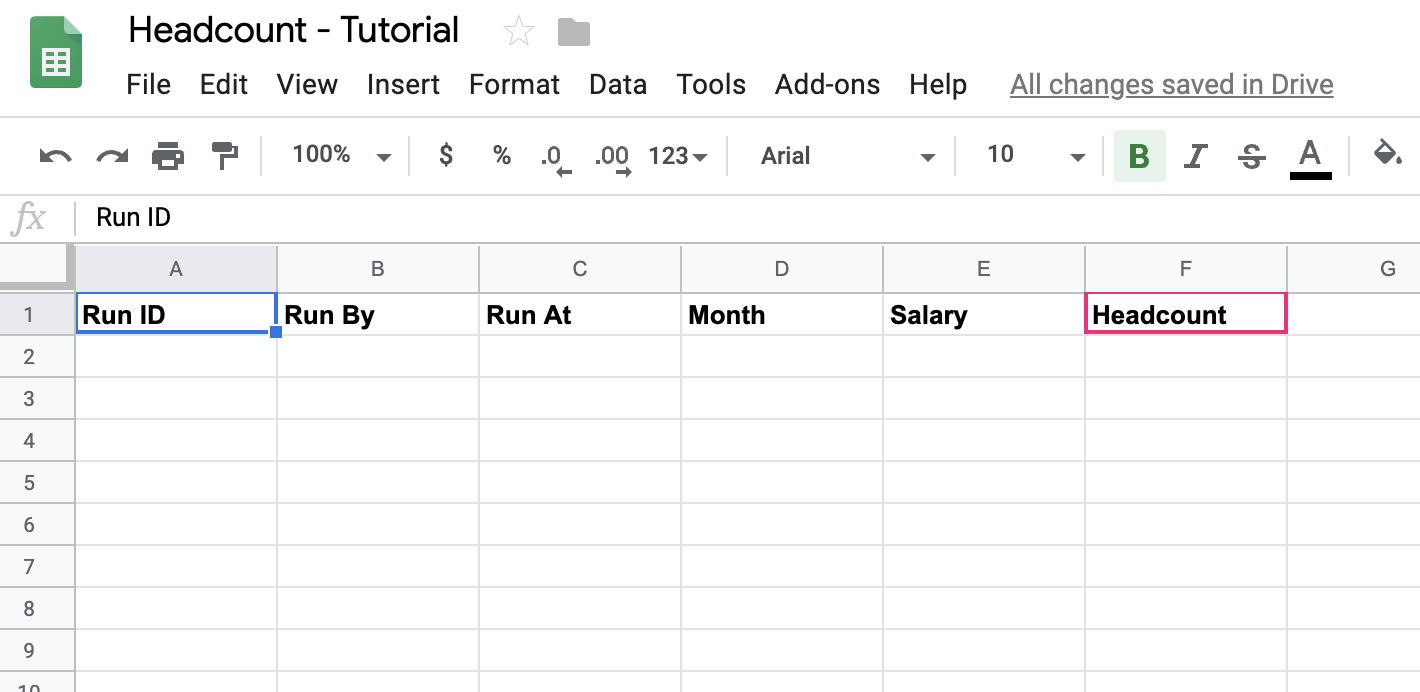
The Monthly Payroll tab should match the following structure and content:
Connecting GSheets to Numbrz
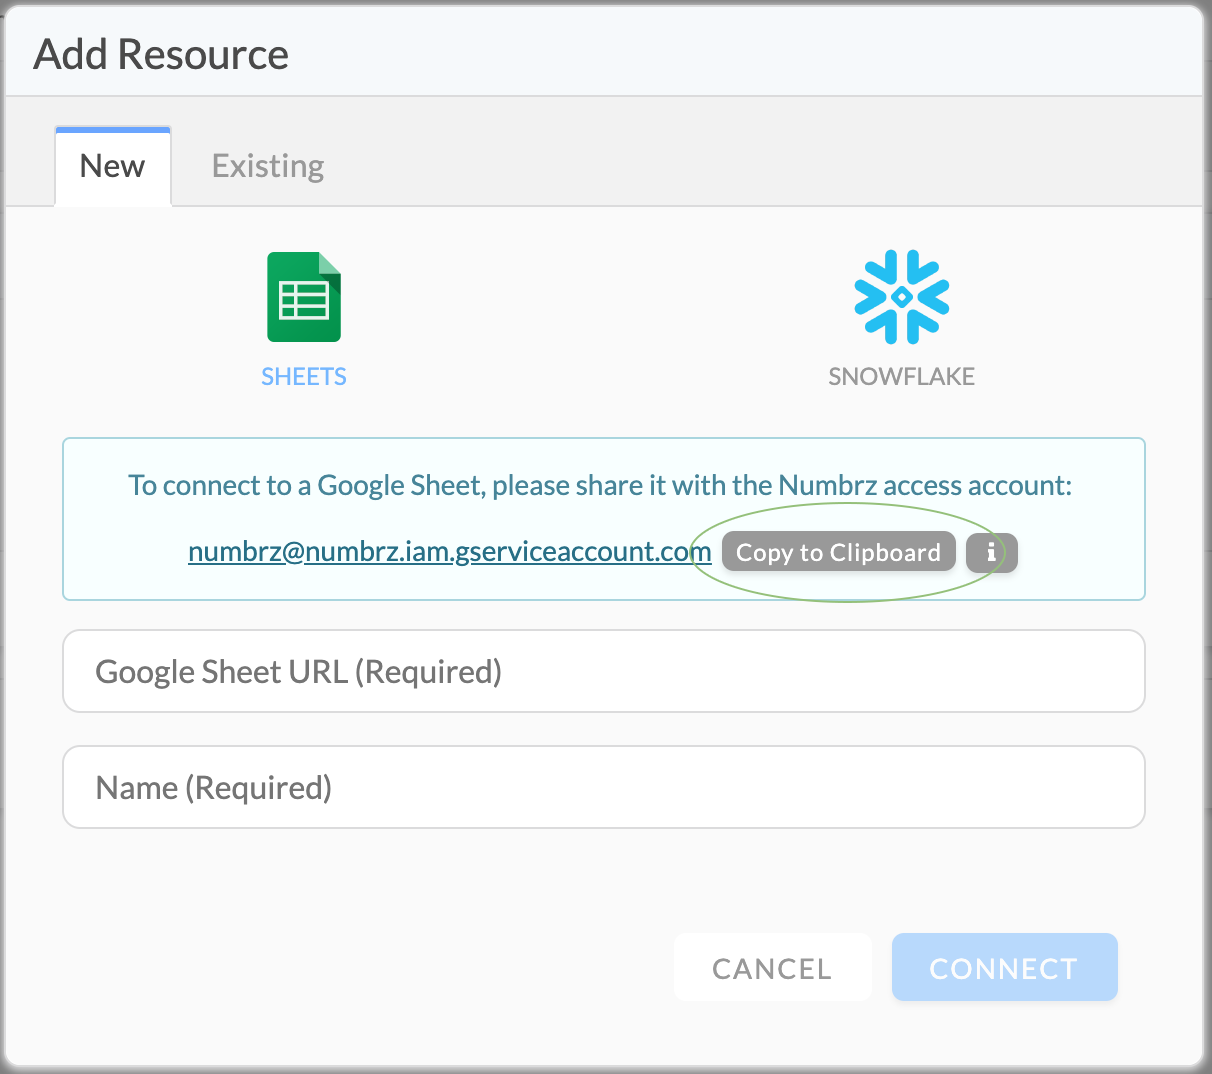
Before we can use the GSheets we created in our workflow, we need to connect them to Numbrz. Connecting external data sources is easy, simply click the '+' icon located on the bottom right corner of the Data tab screen and fill out the necessary information. In our case, we want to connect a GSheet, which is the default external data source.
For each GSheet tab in our document: copy the url from the browser and paste it into the form, title each dataset accordingly, and click 'Connect'.

We will also need to share our GSheet with Numbrz. To do so, copy the Numbrz agent information from the dialog.
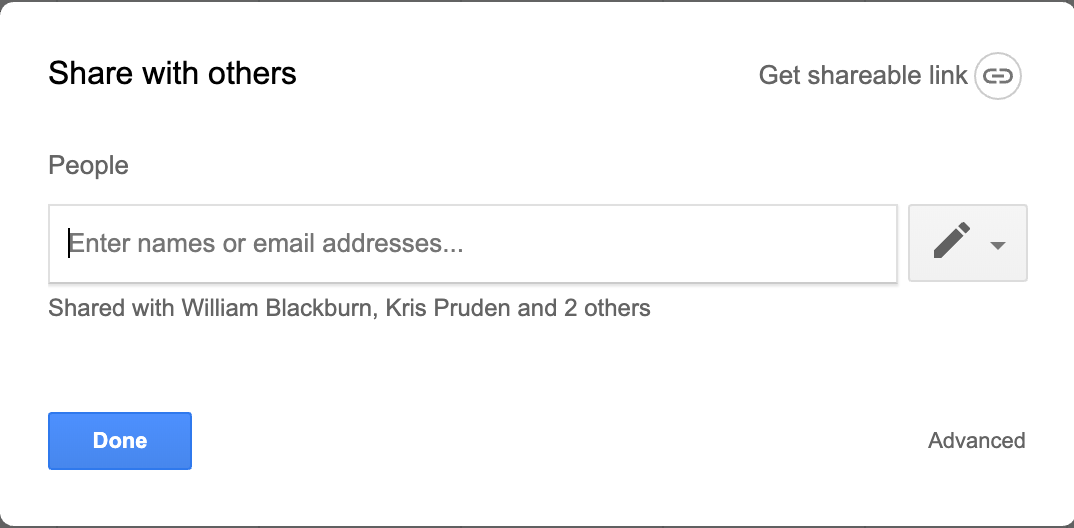
In Gsheets, click 'Share' in the top right corner and paste the copied address into the form.

The final list of datasets in Numbrz should look similar to the one below:
Setting Up A Workflow
Overview
The purpose of this workflow is to combine the execution of the previously constructed Headcount function and some basic aggregation to produce summary output that can be used for planning and forecasting. The workflow will:
Begin a new workflow by selecting the Workflows tab and clicking the '+' in the lower right corner. You should see a dialog similar to the following:
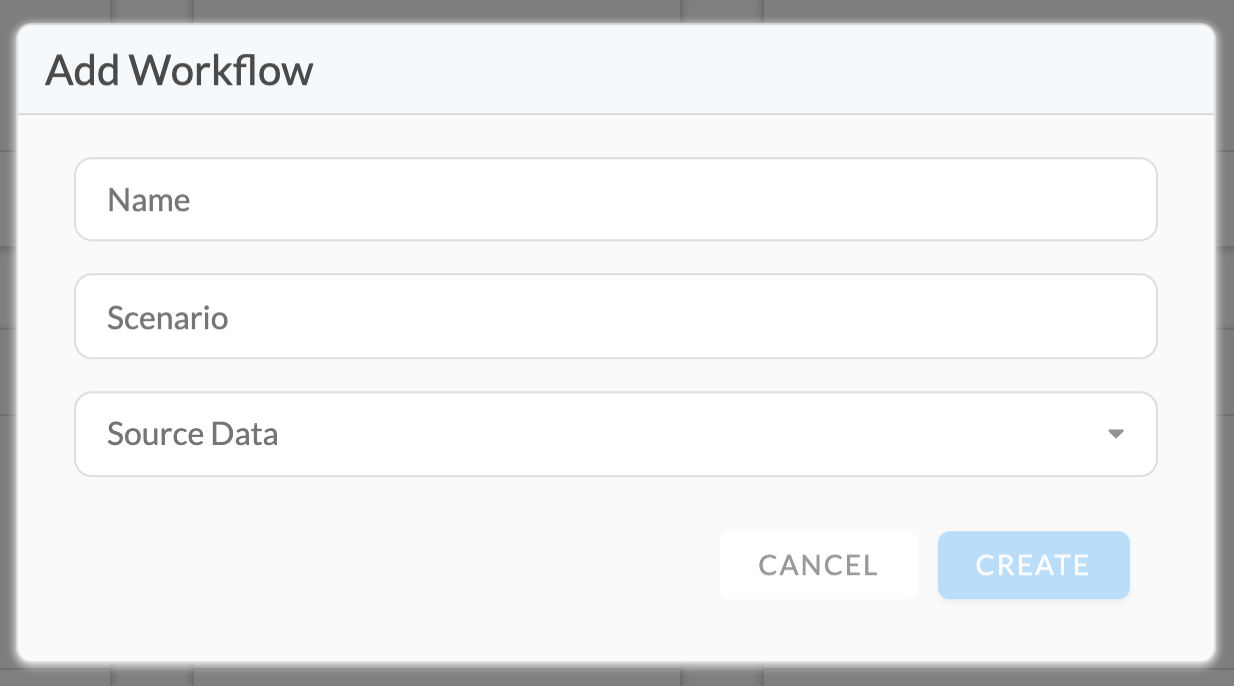
Give your workflow meaningful name like Tutorial - Headcount and optionally a Scenario name, which is just an extra user-definable category you may apply to your workflows. Finally, in the Source Data drop down, select the Employee Payroll dataset previously configured and click Create. You will now see the Workflow Builder.
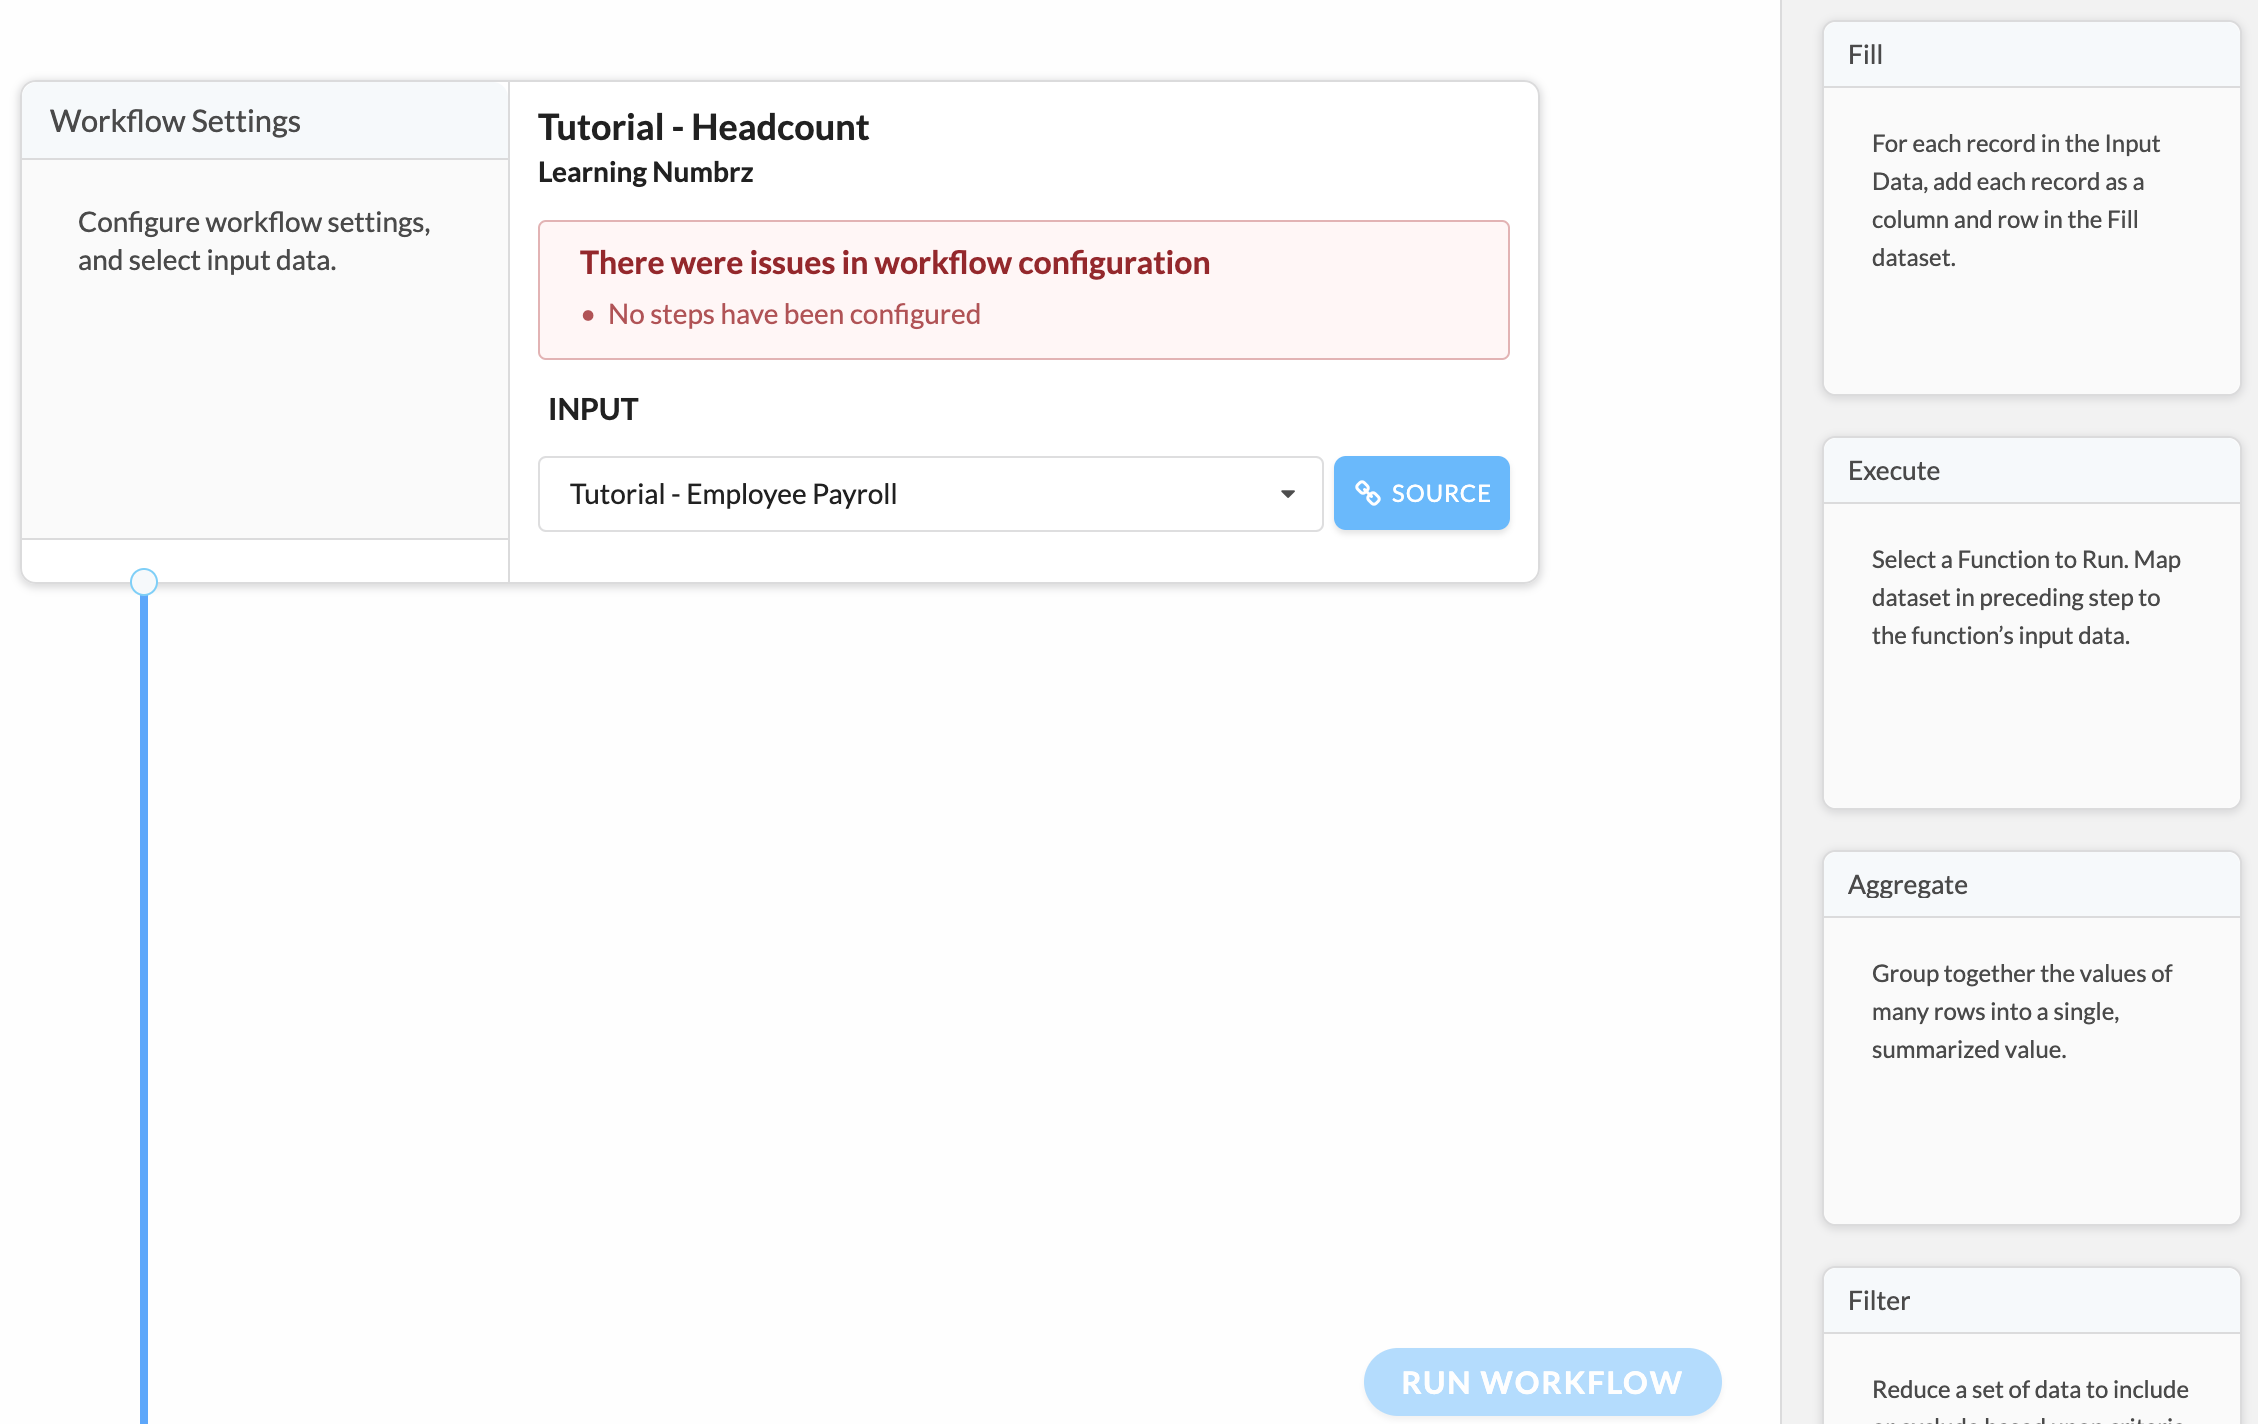
Note the warning letting you know that no steps have been configured. We will now add steps to make this workflow functional.
Combine Data Step
The first step to add will be a Combbine step. Combine produces a union of input data and some other dataset. It will produce up to 300 combined records for each input record. A common use of Combine is to join data with a calendar of dates, which is what we will do.
Drag the Combine step from the palette to the right and drop it below the Workflow Settings. Note that you can edit the default title 'Combine Data Step' to make it more meaningful try changing the title to Apply Calendar. Now select the Calendar dataset you previously created from the drop down and, in the fields section, select the Month field. Your workflow should now look like this.
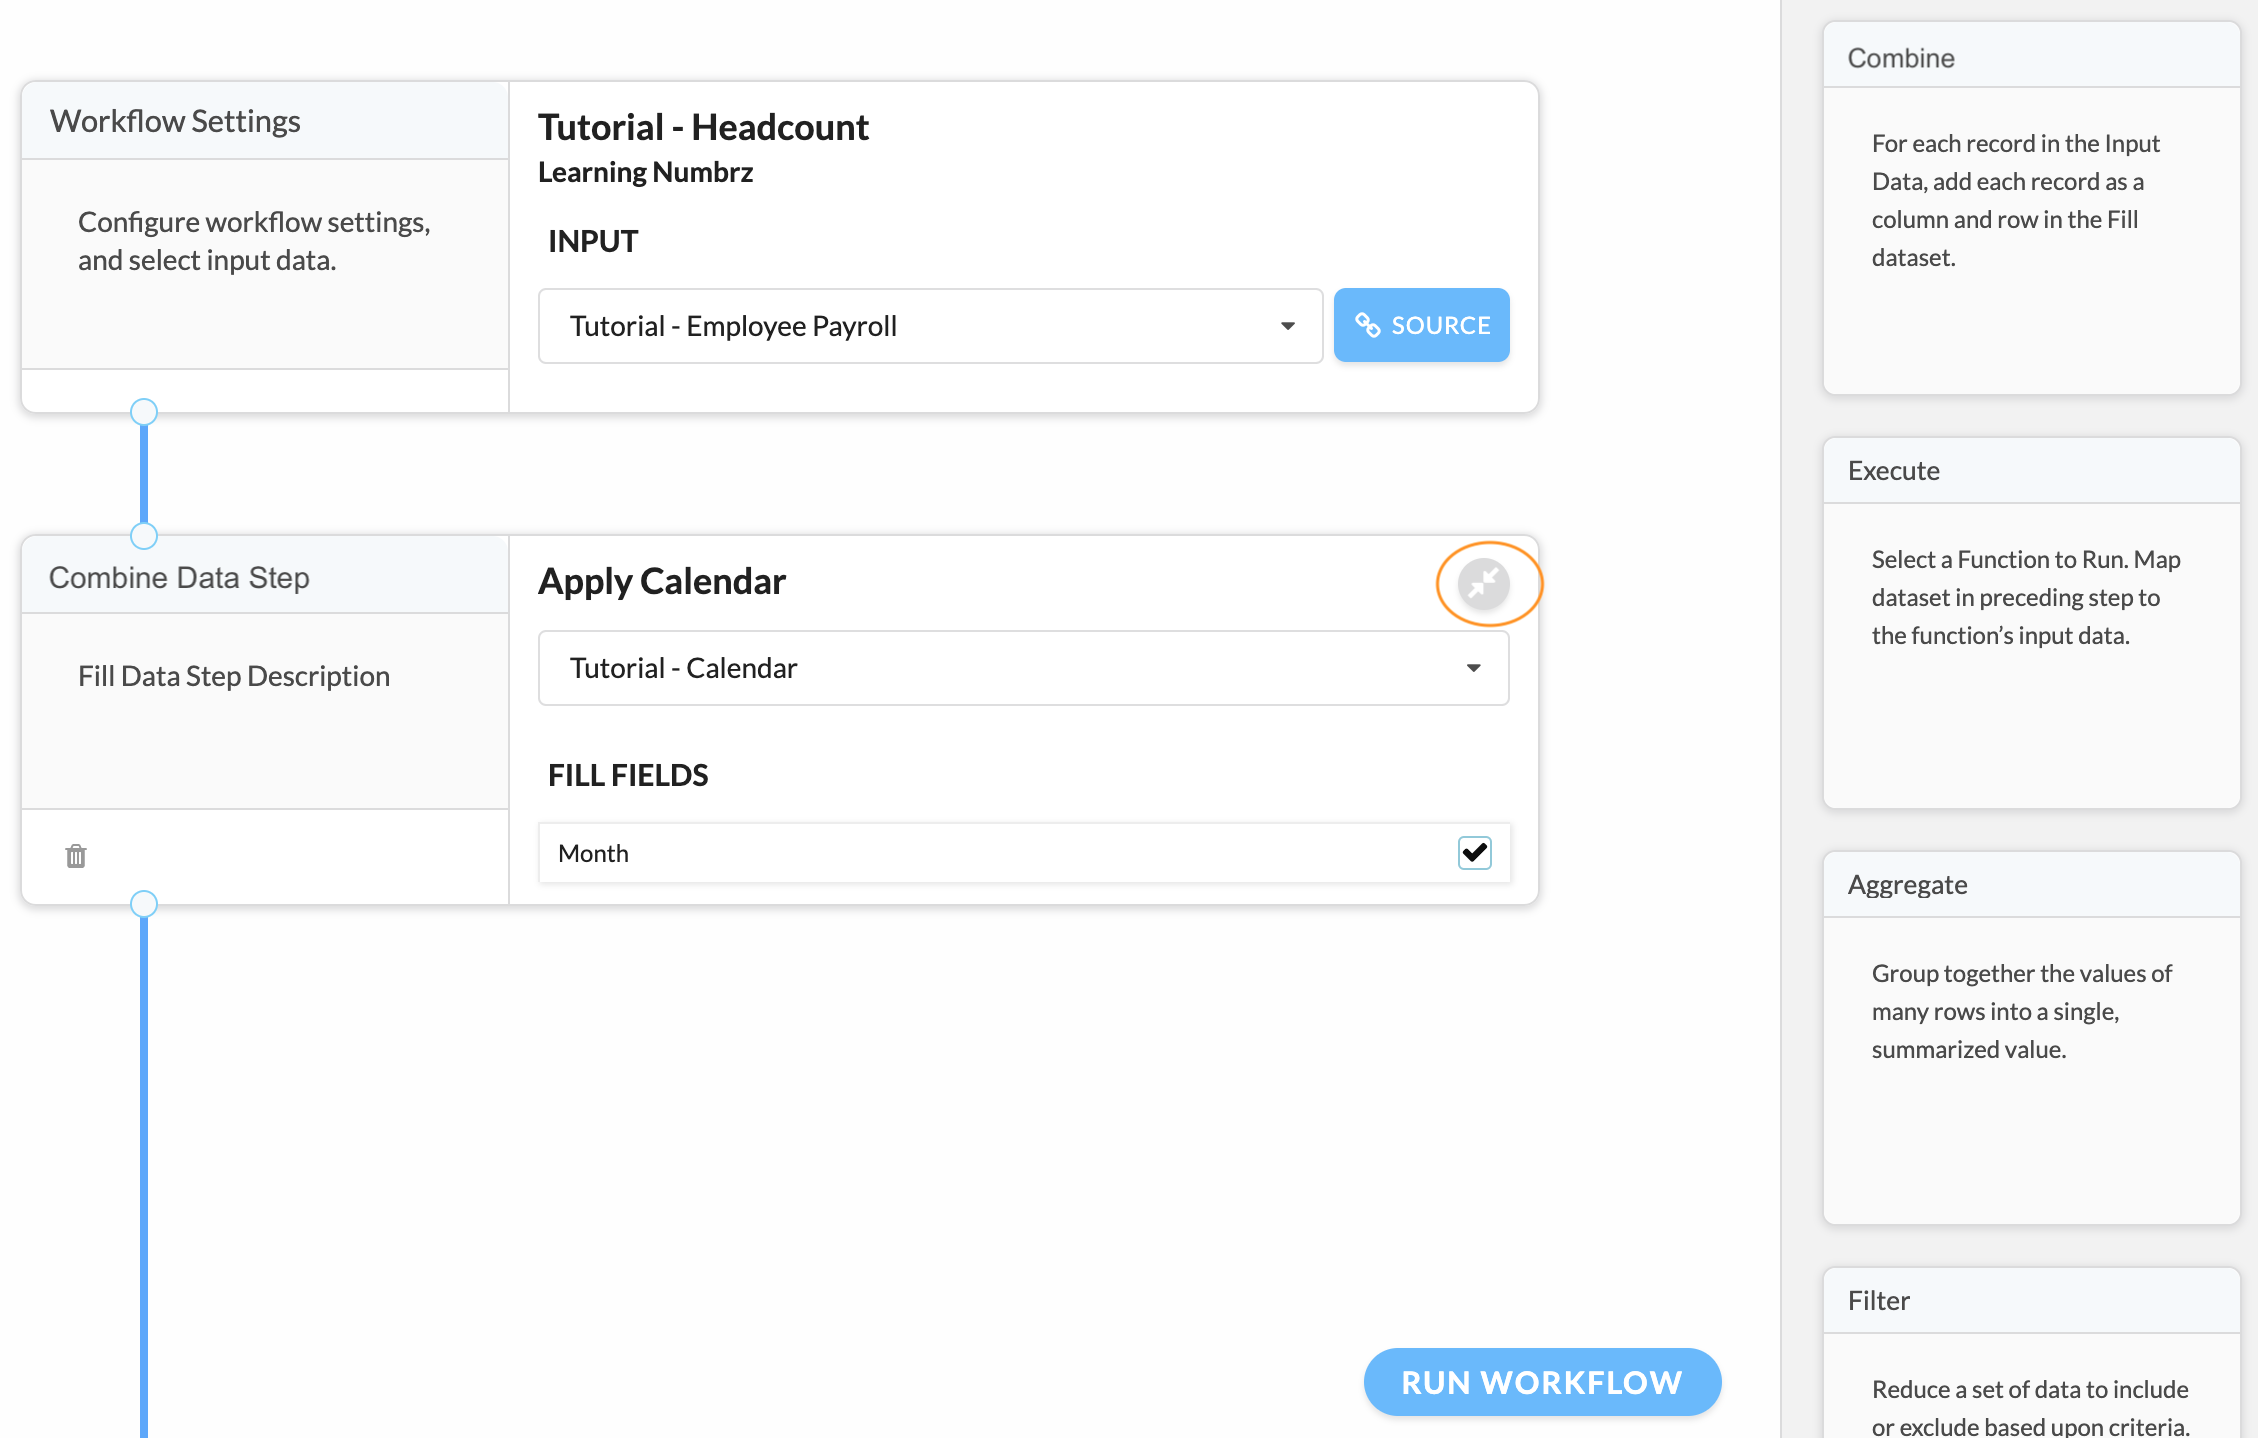
Note the icon to the right of the step title. This is a expand/collapse button. It can be helpful to collapse the configurations as you complete each step, making more room on screen to view the workflow without scrolling.
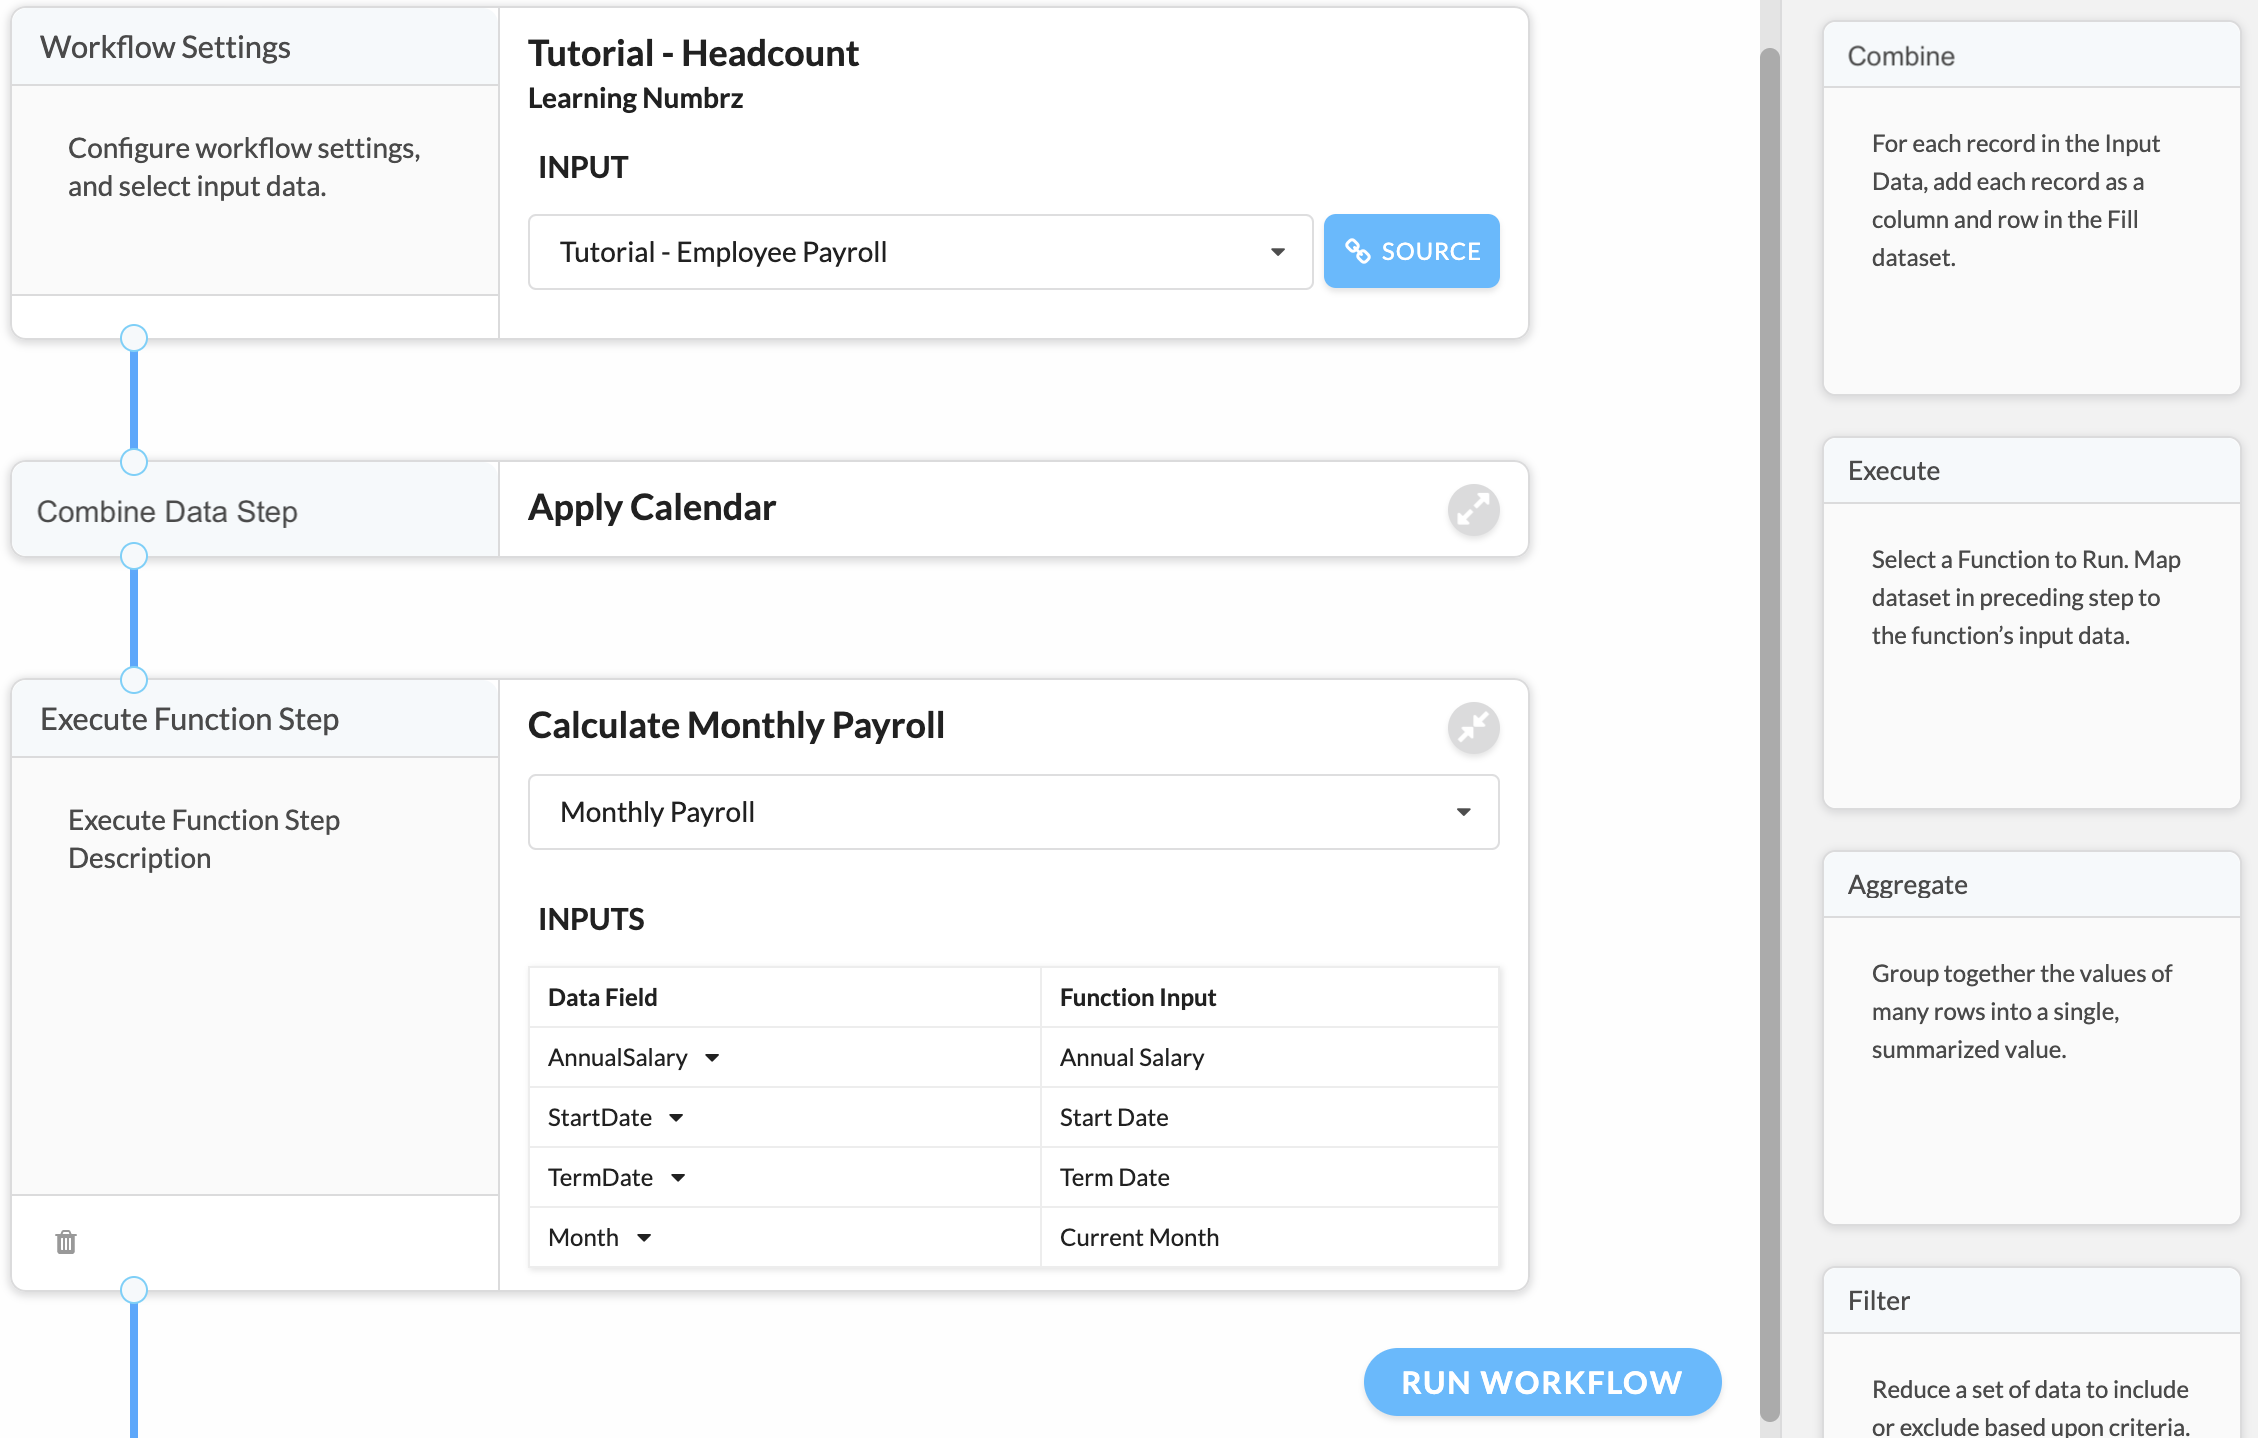
Execute Function Step
Now we have employee payroll data and our period month ends flowing through the workflow. We will use our Payroll function to actually calculate the employees total salary per period.
To execute a function, drag an Execute step from the palette and drop it below the Combine step. Give the step a name like Calculate Monthly Payroll and , from the drop-down, select the function you built previously. Under inputs, map workflow data elements to the appropriate function input. Note that the available data fields have been categorized by source.
Workflow Data to Function Input:
Your workflow will now look like this:
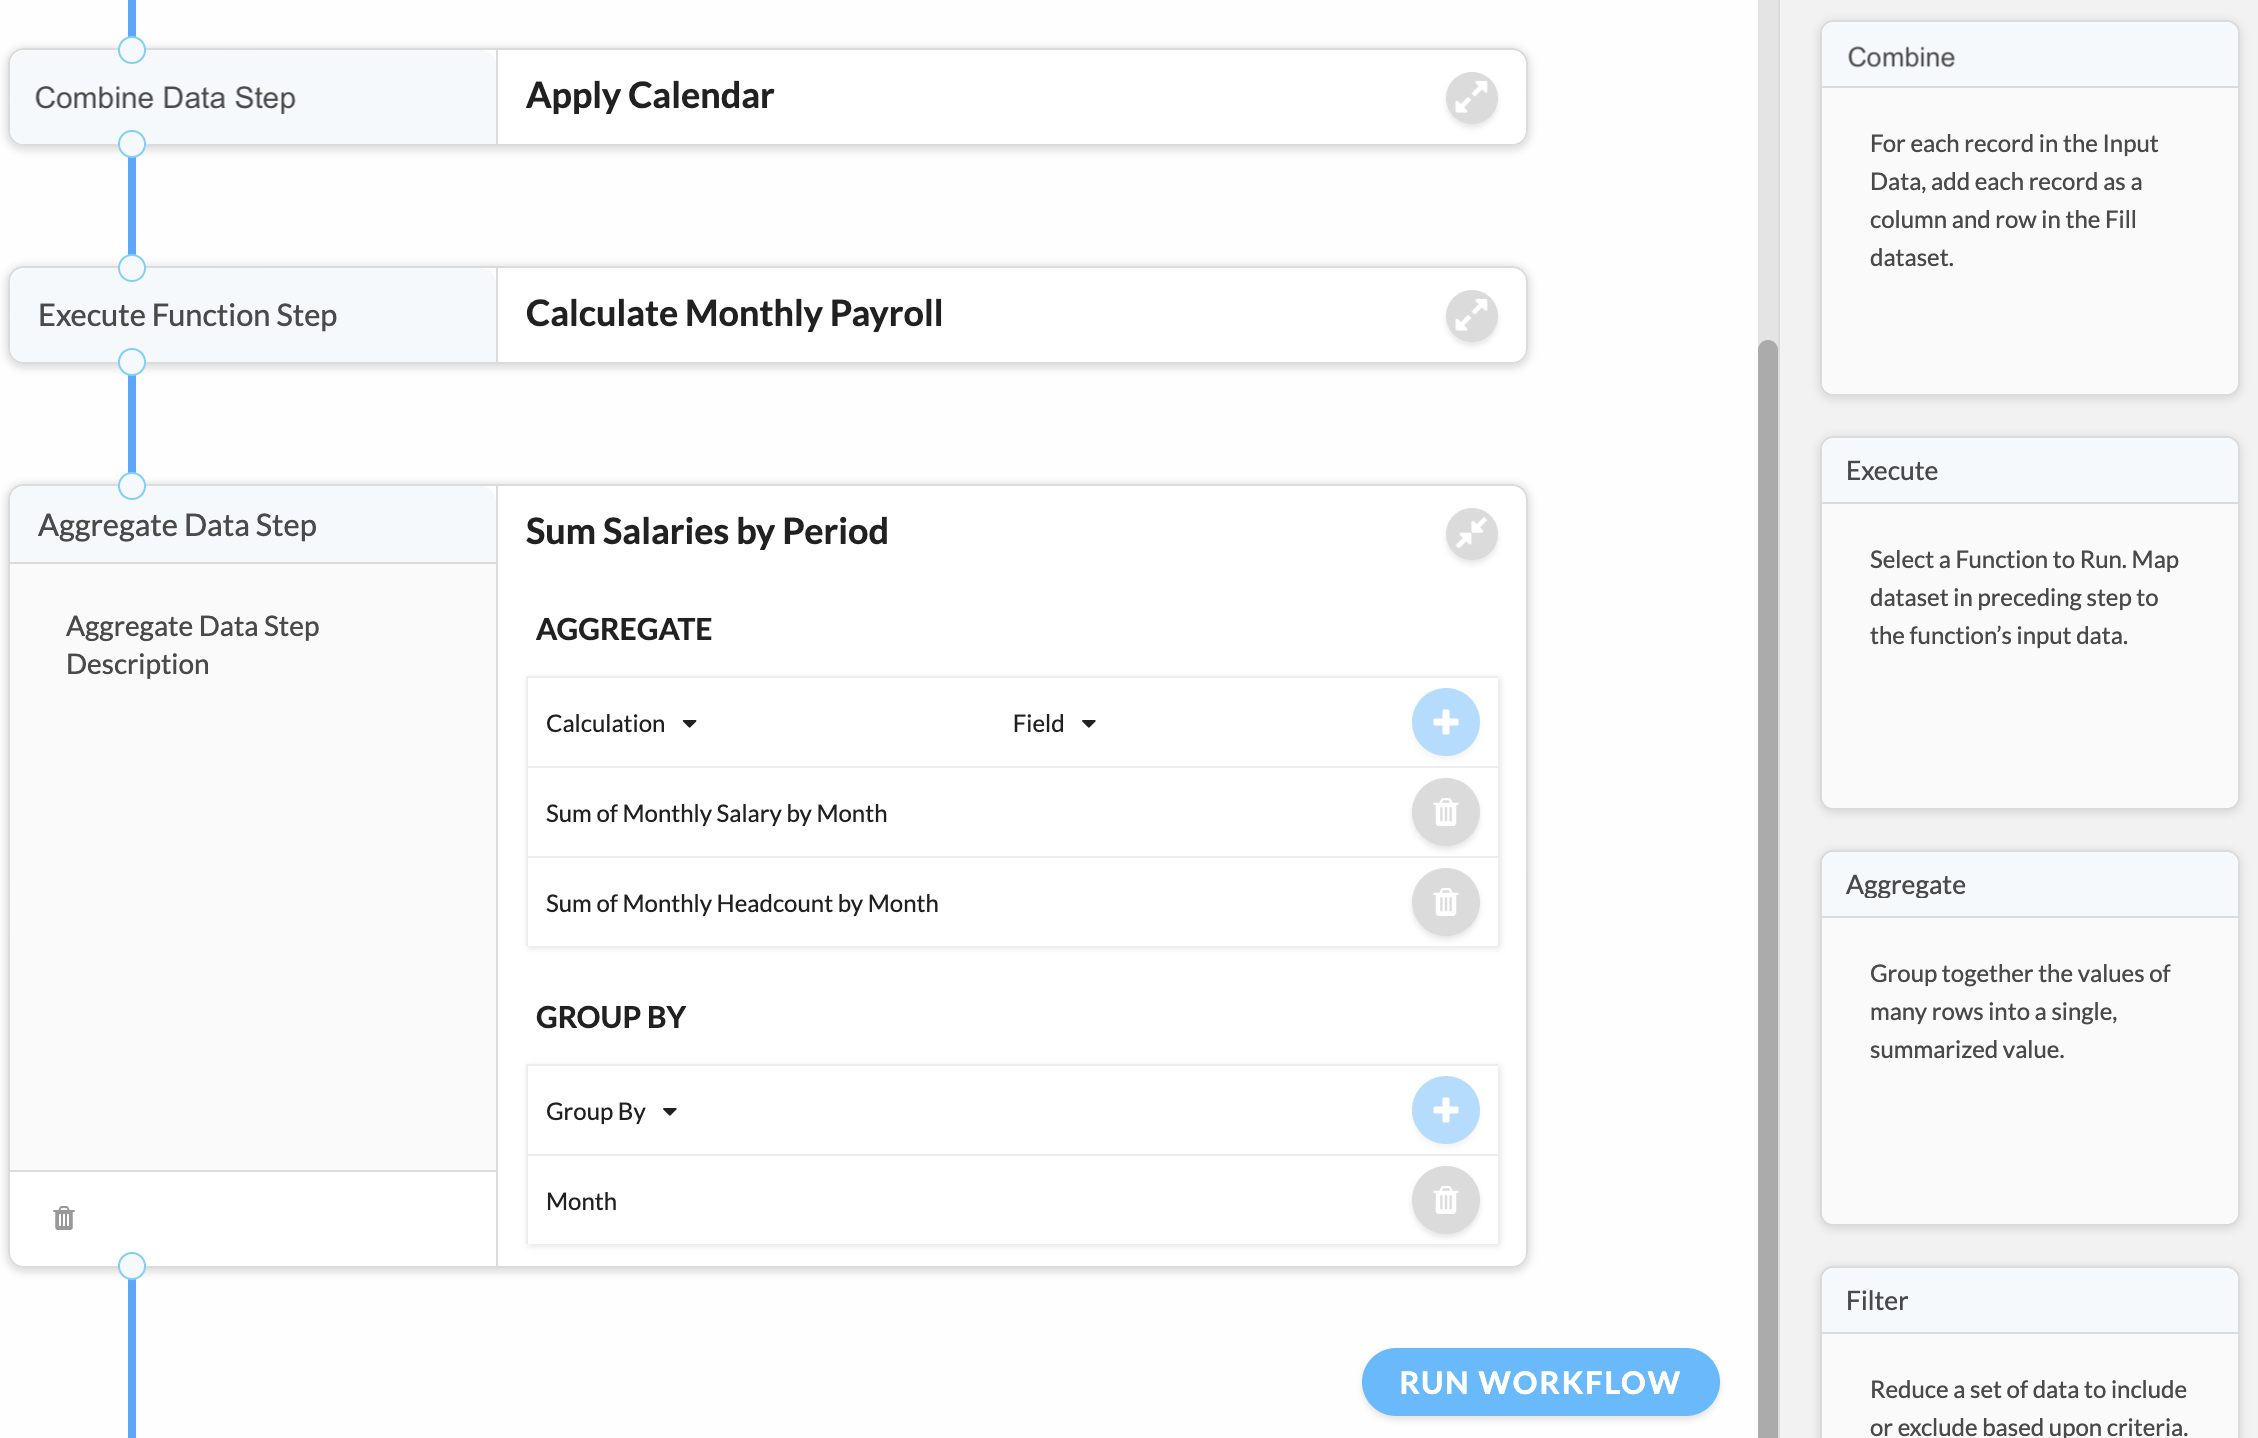
Aggregate Step
Our goal is to produce a forecast by month of payroll costs from our employee data and calendar. To do this, we need to aggregate the payroll data by month. Drag an Aggregate step from the palette, and drop it below the Execute step. Give it a title like Sum Salaries by Period.
Under Aggregate, select Sum for Calculation and Monthly Payroll->MonthlySalary for Field. Click '+' to add this calculation. Add another calculation, Sum on Monthly Payroll->Monthly Headcount, click '+' to add this calculation. Under Group By, select Tutorial Calendar->Month Click '+' to add this group.
Your workflow will now look like this:
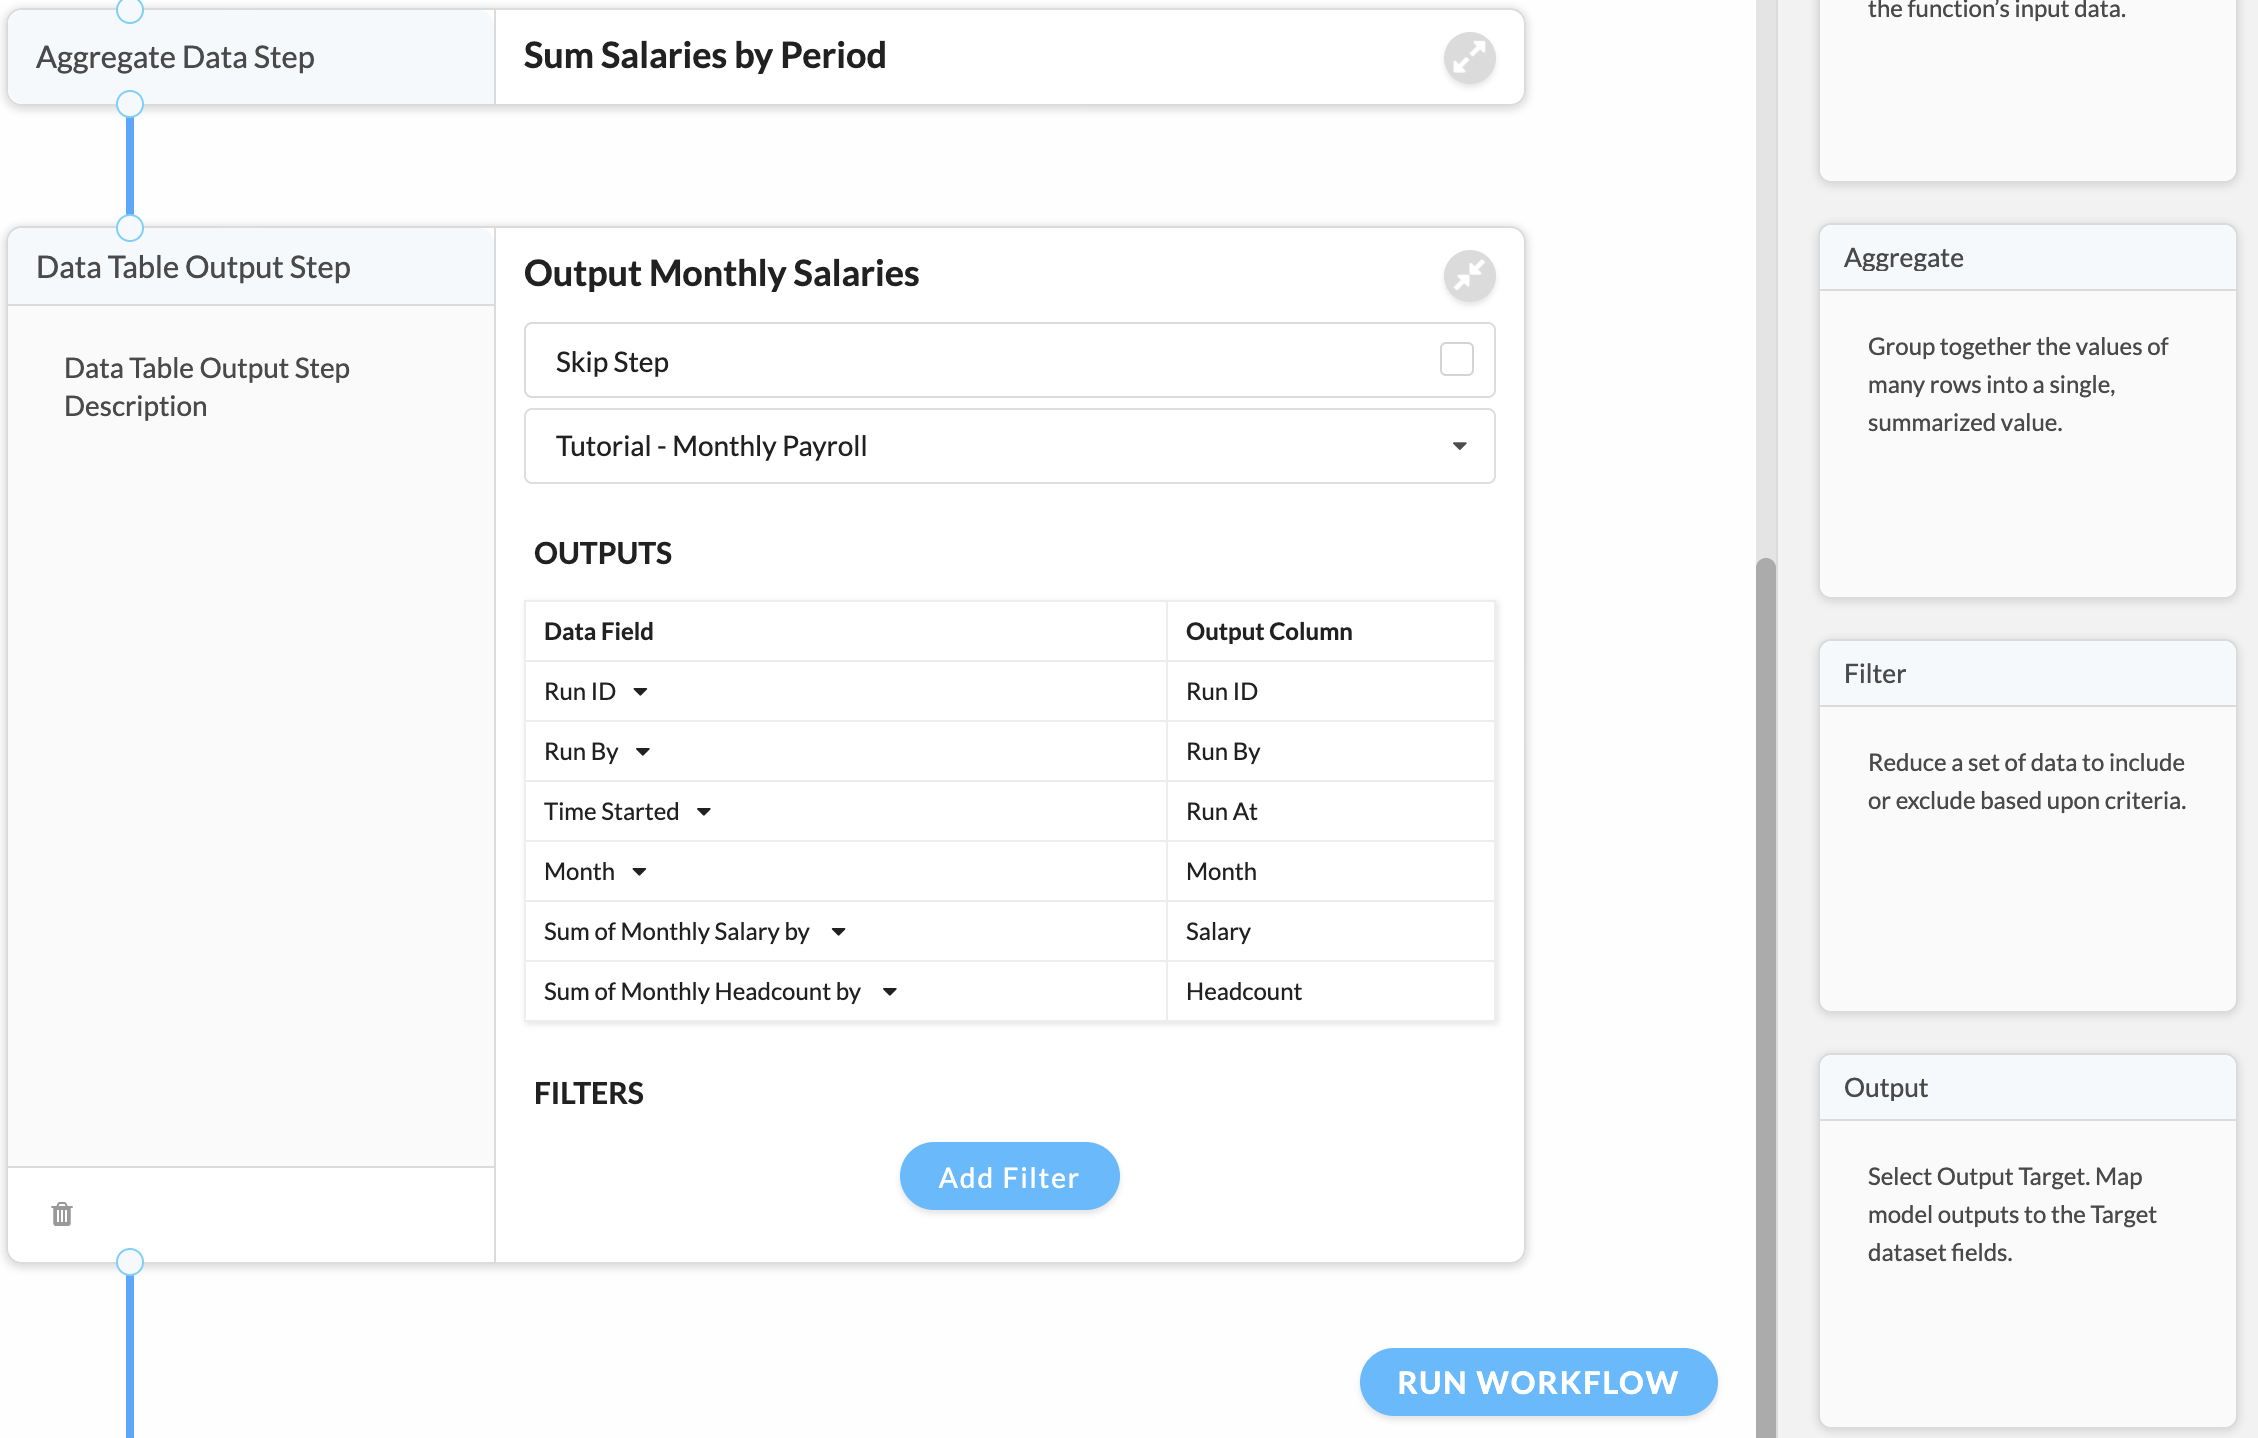
Output Step
This will be the final step in this workflow. It will store results in the Monthly Payroll dataset (A linked Google Sheet) that was created previously. In addition to input data and the results of step processing, several built-in data fields are available. We will use several of these to uniquely identify each execution of our workflow, so that the output data can be used to compare different scenarios.
Start by dragging the Output step from the palette and dropping it below the Aggregate step created above. Give it a title like Output Monthly Salaries.
Under outputs, map workflow data elements to the appropriate dataset field. Note that the available data fields have been categorized.
Workflow Data to Output Dataset:
Your workflow should now look like this:
Running Headcount Workflow
Once all steps have been added, and no configuration warnings are displayed, the workflow is ready to run.
Click Run Workflow in the lower right corner to execute the workflow. You will see a status page. Note that workflows run in the background, so there is no need to wait on the status page, however in this case, the workflow should complete in just a few seconds, so we'll watch what happens. If all goes as it should, you will see the following after a few seconds:
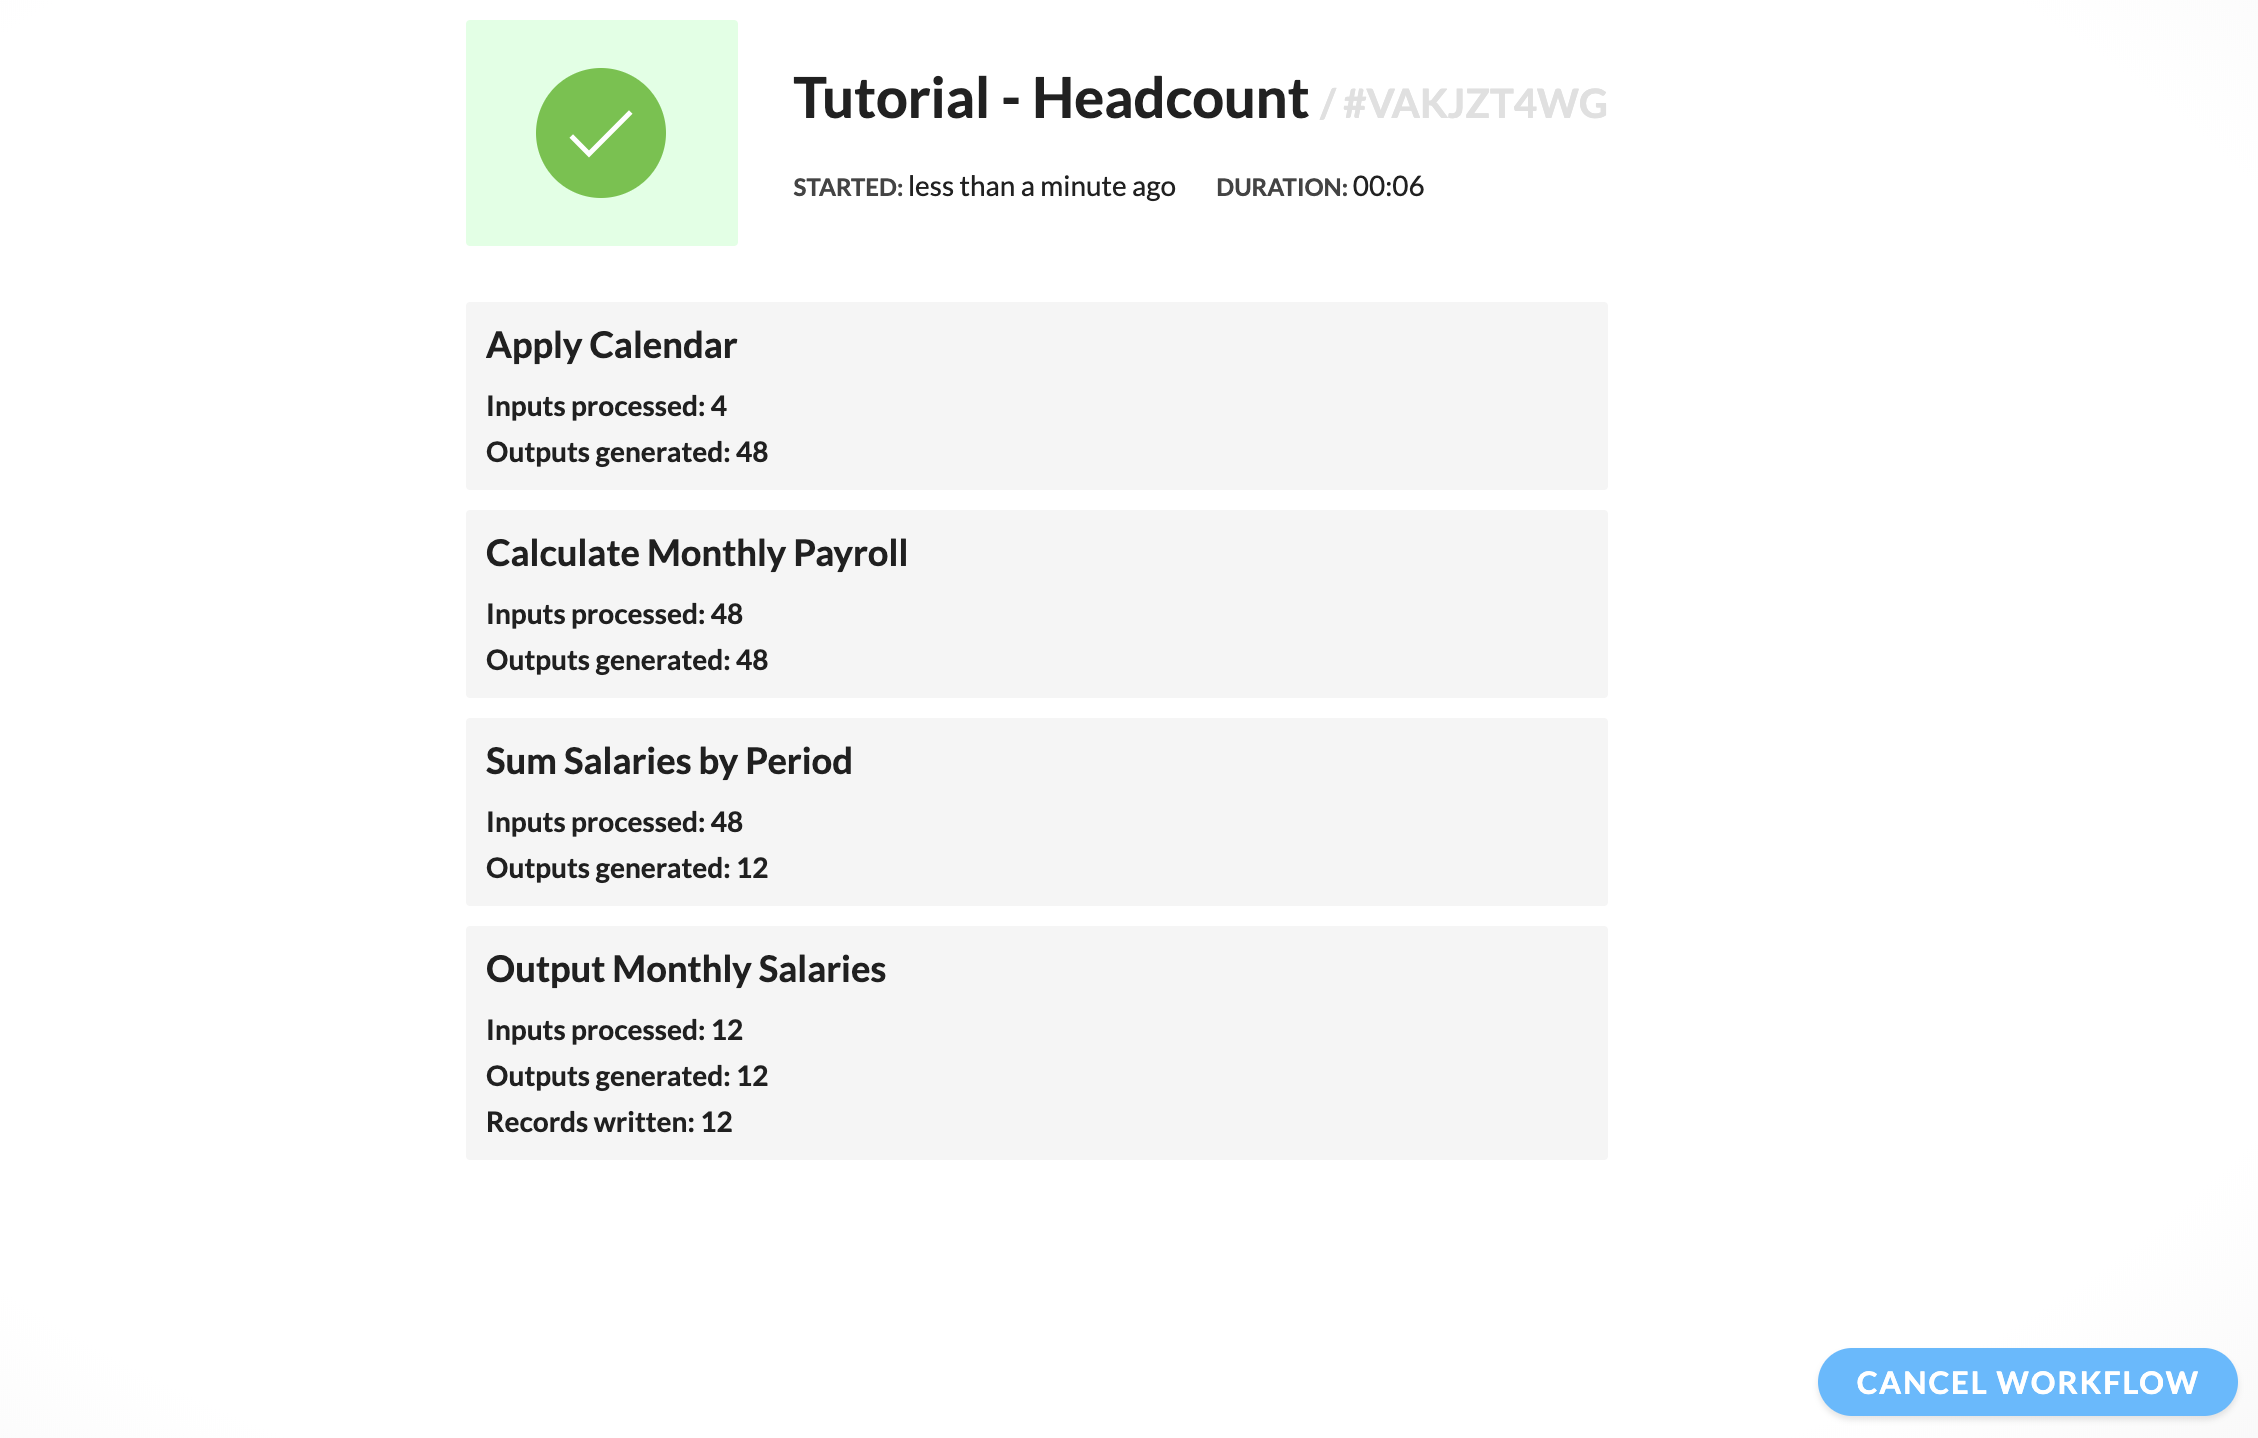
The counts displayed on the final status may be different for you, depending on how much sample data you added to your Google Sheets. Have a look at your Monthly Payroll sheet. You should see one row of data for each month in your calendar.